


















Lesson 40 of 47 · Sustainability and Recycling
Life Cycle Assessment and Microplastics
Learn how life cycle assessment compares materials per function, how to compute a reuse break-even, and what microplastics are, where they come from and how size scales.
Is a plastic bottle better or worse for the climate than a glass bottle? The honest answer starts with "it depends," and the skill is knowing what it depends on. Life cycle assessment (LCA) is the standard method for turning that vague answer into a structured calculation: count what goes in and what comes out at every stage of a product's life, then compare alternatives that do the same job.
The second half of the lesson turns to a problem LCA alone does not capture: tiny polymer particles. Microplastics have been found from mountaintops to ocean trenches. You will learn how they form, how particle size changes everything from particle count to surface area, and what is and is not yet known about their effects.
What you will learn
- Describe the four phases of an LCA and define functional unit and system boundary.
- Compute a reuse break-even between a single-use and a reusable container.
- Define microplastics, name their main sources and describe how plastics fragment.
- Calculate how particle count and surface area scale with particle size.
Key terms
Life cycle assessment (LCA): a standardized method (ISO 14040 and 14044) for quantifying environmental impacts across a product's life.
Functional unit: the service the comparison is based on, such as "deliver 1,000 liters of drink".
System boundary: the stages and processes included in the analysis.
Global warming potential (GWP): the climate impact expressed as kilograms of CO₂ equivalent over a stated period, commonly 100 years.
Microplastic: a plastic particle smaller than 5 mm. Nanoplastics are smaller than about 1 µm (definitions vary).
The four phases of an LCA
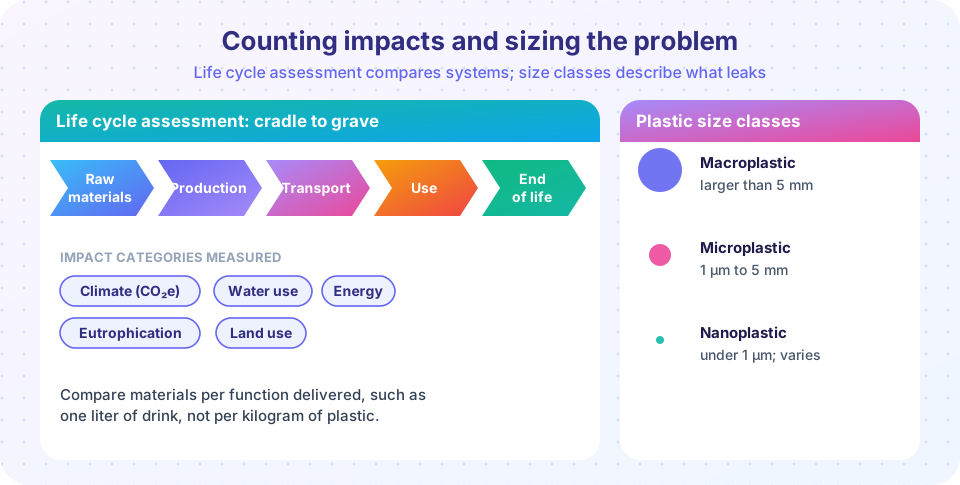
- Goal and scope. State the question, the functional unit and the system boundary. Boundaries are often described as cradle-to-gate (up to the factory exit), cradle-to-grave (through use and disposal) or cradle-to-cradle (including recycling back into new products).
- Inventory. List all inputs (energy, water, raw materials) and outputs (emissions, waste) for each process in the boundary, scaled to the functional unit.
- Impact assessment. Convert the inventory into impact categories: climate (kg CO₂e), acidification, eutrophication (excess nutrients), water use, land use, resource depletion and toxicity.
- Interpretation. Check sensitivity to assumptions, identify the hot spots and state limits.
The functional unit is the key idea. A comparison of one kilogram of plastic against one kilogram of glass is meaningless; a comparison of 1,000 liters of drink delivered by each is fair, because the mass of the container, number of reuses, transport weight and end of life all enter.
Where the surprises come from
LCAs often overturn intuition for four reasons.
- Use phase dominates for some products. For a car or a building insulation, the energy saved by a lighter or better-insulating polymer over the life can dwarf the production impacts.
- Reuse changes the denominator. A heavy refillable bottle pays its production cost over many trips.
- Transport and weight matter: lighter packaging lowers the fuel used to move it.
- Allocation and system boundaries can change results. How credits for recycling are assigned is a choice, and that choice should be disclosed.
Worked example: reuse break-even
Let a single-use container have a production impact E₁ per container and a reusable container have E_r per container plus a wash impact w per trip. After n trips the reusable container costs E_r / n + w per use. The reusable option wins when
E_r / n + w < E₁ → n > E_r / (E₁ − w)
Using purely illustrative numbers: E₁ = 0.12 kg CO₂e, E_r = 0.60 kg CO₂e, w = 0.04 kg CO₂e per trip. Then n > 0.60 / (0.12 − 0.04) = 7.5, so about eight or more trips are needed. If the real return rate is low, so that a typical bottle makes only three trips, the reusable option loses. This is a result about the method: the numbers are placeholders, and an actual study uses measured data.
Microplastics
Definitions and size classes
By a common convention, macroplastics are larger than 5 mm, microplastics lie between about 1 µm and 5 mm and nanoplastics are below about 1 µm (some authors use 100 nm). Primary microplastics are manufactured small: microbeads in cosmetics (now banned in rinse-off products in many countries), industrial abrasives and the nurdles (pre-production pellets about 2 to 5 mm across) that spill during transport. Secondary microplastics form when larger items break down.
Where they come from
- Tire wear: abrasion of tire tread, which contains rubber and many additives, is widely considered one of the largest sources by mass.
- Synthetic textiles: washing releases fibers from polyester and nylon fabrics.
- Fragmentation of litter and mismanaged waste, including fishing gear.
- Paints, road markings and coatings, and plastic films in agriculture.
How a polymer fragments
Sunlight (UV) drives photo-oxidation: radicals form, chains scission and oxidized groups such as carbonyls appear (the 1710–1740 cm⁻¹ band you saw in FTIR). The surface becomes brittle and cracks. Waves, wind and abrasion then flake off tiny pieces. Because oxidation starts at the surface, the particles are rough and have a high surface-to-volume ratio. This is why stabilizers (UV absorbers and antioxidants) extend a plastic's service life but also delay its fragmentation.
Why size matters: counting particles
For spheres of diameter d and density ρ, the volume is π d³ / 6, so the number of particles in one gram is
N = 6 / (π ρ d³)
and the surface area per gram is 6 / (ρ d). Halving the diameter gives eight times as many particles and twice the surface area for the same mass. For polyethylene (ρ ≈ 0.95 g/cm³):
| Diameter | Particles per gram | Surface per gram |
|---|---|---|
| 1 mm | about 2 × 10³ | about 0.006 m² |
| 100 µm | about 2 × 10⁶ | about 0.063 m² |
| 1 µm | about 2 × 10¹² | about 6.3 m² |
A single gram of polymer can become trillions of particles. Large surface area means more contact with the environment, so small particles can adsorb pollutants or leach additives more readily.
What is known and what is uncertain
Microplastics have been detected in oceans, freshwater, soils, air, food and drinking water, and particles have been found in human tissue samples. Laboratory studies show that organisms can ingest them, and some show effects at high concentrations. How much harm particles do at the levels people are actually exposed to, and how much is due to the polymer itself rather than the chemicals added to it, is still under active research, and measurement methods are not yet standardized. Because particles are practically impossible to retrieve once dispersed, many strategies focus on prevention at the source: better tire and textile design, filters on washing machines, pellet-handling rules, bans on intentionally added microplastics and extended producer responsibility.
Common misconceptions
"LCA gives one correct answer." It gives an answer conditional on goal, boundary, data and assumptions. Good studies state these and test sensitivity.
"All plastic pollution is visible litter." Much of it is invisible: fibers, tire dust and fragments.
"Natural materials are always the greener choice." Cotton bags or glass bottles can have lower or higher impacts depending on how many times they are reused. The number of reuses is often what decides.
Try it
First, the reuse break-even. Edit the placeholders (they are illustrative, not measured) and see how the number of required trips responds to the wash impact and to the production impact of the reusable container.
Press Run (or Ctrl + Enter) to see the result here.
Program input · what you'd type while the program runs
Type the answers before you press Run, one per line. Each time the program reads a line (with input()), it gets the next line from this box.
Second, particle count and surface area as particle diameter shrinks, for polyethylene beads of one gram.
Press Run (or Ctrl + Enter) to see the result here.
Program input · what you'd type while the program runs
Type the answers before you press Run, one per line. Each time the program reads a line (with input()), it gets the next line from this box.
Third, a small classifier for particle size classes using the conventions in this lesson.
Press Run (or Ctrl + Enter) to see the console output here.
No output.
Check your understanding
Quick check · 5 questions
of 5 answered You scored / 5 · perfect!
-
1. What is the functional unit in an LCA?
Products are compared per unit of function so differences in mass, reuse and lifetime are fairly counted. -
2. In the reuse formula, the reusable container wins when:
Per use impact E_r/n + w falls below E₁ once n exceeds E_r/(E₁ − w). -
3. By the convention used here, a 2 mm polyethylene pellet is:
Microplastics are particles from about 1 µm up to 5 mm. -
4. If you halve the diameter of spherical particles of the same total mass, the number of particles becomes:
N is proportional to 1/d³, so halving d gives 2³ = 8 times as many particles. -
5. Which is a secondary microplastic?
Secondary microplastics form by the breakdown of larger plastic items.
Summary
- LCA has four phases (goal and scope, inventory, impact assessment, interpretation); the functional unit and system boundary frame the question.
- Results depend on reuse counts, weight, use-phase energy and allocation choices, so assumptions must be stated.
- Microplastics (1 µm to 5 mm) are primary (made small) or secondary (fragmented); main sources include tire wear, textiles and litter.
- Particle number scales as
1/d³and surface area per gram as1/d, so tiny particles are numerous and have large surfaces. - Evidence of presence is strong; the extent of health effects is still under study. Prevention at the source is the most reliable strategy.
Track your progress
Create a free account to tick off lessons and pick up where you left off on any device.
of Polymer and Materials Chemistry lessons completed