


















Lesson 26 of 47 · Characterization
Chapter Review: Characterization
Review the characterization chapter with a one-page summary picture, a recap table, worked checks and a ten-question quiz on GPC, DSC, TGA, IR and XRD.
You have now met the main ways of interrogating a polymer: sorting chains by size, heating them to watch transitions, shining light and X-rays through them and looking at them under microscopes. This review pulls the chapter into one picture, one table and one quiz, so you can check which ideas have stuck.
The aim is not to memorize instruments but to build a reflex: when you see a question about a material, you should immediately know which measurement answers it, what the output looks like and what could mislead you.
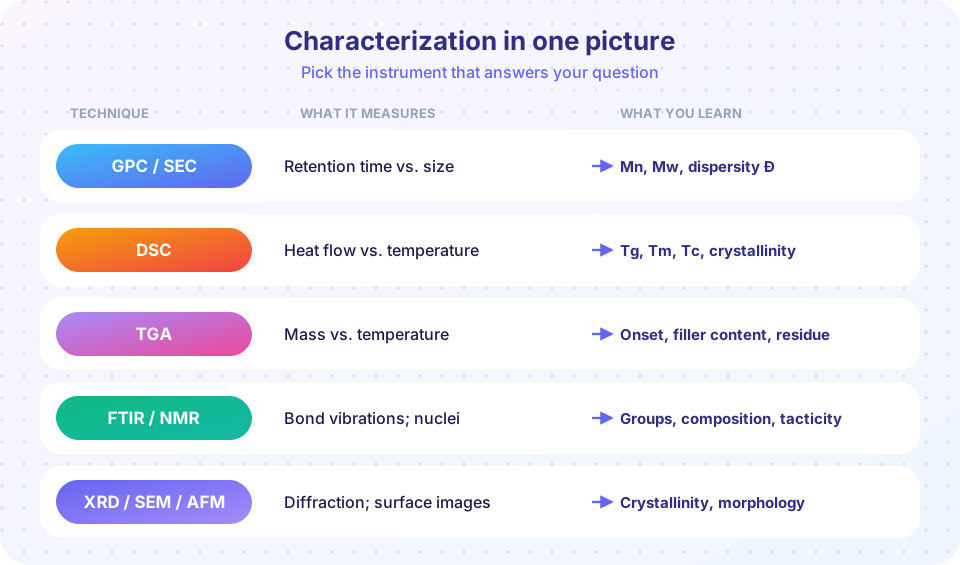
The recap table
| Question | Method | Key output | Watch out for |
|---|---|---|---|
| How long are the chains? | GPC / SEC | Mn, Mw, Mz, Đ | Relative to the calibration standard unless light scattering is used |
| When does it soften or melt? | DSC | Tg (step), Tc (exo peak), Tm (endo peak) | Heating rate, first vs. second heat |
| How crystalline is it? | DSC, XRD | Xc = (ΔHm − ΔHcc)/(w ΔHm°); peak area vs. halo |
Literature ΔHm° varies; correct for filler |
| How stable is it, what is in it? | TGA | Onset, mass-loss steps, residue | Atmosphere (N₂ vs. air), filler that loses mass |
| What groups are present? | FTIR | Bands: C=O 1730, C–H 2900, O–H 3300 cm⁻¹ | ATR probes only the surface layer |
| What is the composition or tacticity? | NMR | Integrals, chemical shifts | Needs a dissolved sample |
| How are chains packed? | XRD / SAXS | d-spacings, crystallite size | Peak broadening from small crystals and the instrument |
| What does it look like? | Optical, SEM, TEM, AFM | Images from µm to nm | Coating, staining and vacuum change the sample |
Three formulas worth knowing by heart
Mn = Σ Nᵢ Mᵢ / Σ Nᵢ      Mw = Σ Nᵢ Mᵢ² / Σ Nᵢ Mᵢ      Đ = Mw / Mn
Xc = (ΔHm − ΔHcc) / (w × ΔHm°)
n λ = 2 d sin θ
How the lessons connect
The three lessons of this chapter look different but share a pattern: a probe interacts with the sample, the response is recorded, and a model converts the response into a property. In GPC the probe is a flow through porous beads and the model is a calibration curve. In DSC it is a temperature ramp and the model is the heat balance. In FTIR it is infrared light and the model is bond vibration. In XRD it is X-rays and the model is Bragg's law. If you know the probe and the model, you know what the technique can and cannot tell you.
Think also about what happens in a real project. You rarely use one method alone. A plastic part that fails might get an FTIR spectrum to identify the polymer, a DSC scan to check its crystallinity and thermal history, a TGA run to check the filler, and a GPC trace to see whether the chains have been shortened by processing. Each result narrows the explanation, and agreement between independent methods builds confidence.
Self-check list
Make sure you can do each of these without notes:
- Calculate Mn, Mw and dispersity from a table of chain counts and masses.
- Identify Tg, Tc and Tm on a DSC trace and compute percent crystallinity.
- Explain why TGA residue in air usually means inorganic filler.
- Read an IR spectrum for a carbonyl band and a C–H band.
- Apply Bragg's law and say what a broad diffraction peak means.
If any of these is shaky, reopen the matching lesson and rerun its Try it cell.
Try it
Here is a quick self-test of the arithmetic: the cell below checks the three worked numbers from the chapter. If you change an input, predict the output before running.
Press Run (or Ctrl + Enter) to see the result here.
Program input · what you'd type while the program runs
Type the answers before you press Run, one per line. Each time the program reads a line (with input()), it gets the next line from this box.
Check your understanding
Quick check · 10 questions
of 10 answered You scored / 10 · perfect!
-
1. Which statement about Mn, Mw and Mz is always true for a sample with different chain lengths?
Each successive average weights heavier chains more strongly, so the sequence increases. -
2. A sample of 50 chains of 20,000 g/mol and 50 chains of 60,000 g/mol has an Mn of:
Mn = (50×20,000 + 50×60,000) / 100 = 40,000 g/mol. -
3. In GPC, why do large chains leave the column before small ones?
Size exclusion: big coils are excluded from the pores, small ones diffuse into them and are delayed. -
4. On a DSC trace a downward peak (exo up convention) at 230 °C is:
Melting absorbs heat, so it is an endotherm, drawn downward when exotherms point up. -
5. A PET sample has ΔHm = 38 J/g and ΔHcc = 20 J/g (ΔHm° = 140 J/g). Its crystallinity is about:
Xc = (38 − 20)/140 × 100 ≈ 12.9 %. -
6. TGA of a polymer in air leaves 18 % of its mass at 800 °C. The best first interpretation is:
In air the organic part burns away, so the residue is probably glass, talc or another inorganic filler (check whether it loses mass itself). -
7. Which IR band separates PMMA from polyethylene most clearly?
Both have C–H bands, but only PMMA has an ester carbonyl. -
8. Using Bragg's law, a larger diffraction angle 2θ (same λ) corresponds to:
d = λ / (2 sin θ), so as θ increases, d decreases. -
9. Which technique is best for imaging the 10 nm domains of a stained block copolymer?
TEM resolves nanometer features, and staining provides contrast between blocks. -
10. Why compare second-heat DSC scans when ranking two resins?
Heat-cool-heat erases the thermal and mechanical history imprinted by molding or storage.
Summary
- Characterization is organized by question: size, heat, chemistry, shape.
- Know the outputs: Mn/Mw/Đ (GPC), Tg/Tc/Tm/Xc (DSC), onset/residue (TGA), bands (FTIR), d-spacings (XRD).
- Every method has a bias; two independent methods that agree are the strongest evidence.
- Next, you will apply this toolkit to real materials: commodity plastics, engineering resins, rubbers and fibers.
Track your progress
Create a free account to tick off lessons and pick up where you left off on any device.
of Polymer and Materials Chemistry lessons completed