


















Lesson 39 of 48 · Field Methods and Maps
Topographic maps: scale, contours and profiles
Learn to read map scale, contour lines, contour interval and relief, calculate gradient and slope angle, and draw a topographic profile with vertical exaggeration.
Before you can describe the rocks, you need to know where you are and what the land looks like. A topographic map shows the shape of the ground (its topography) using lines of equal elevation, along with rivers, roads, buildings and place names. A geologist reads it for more than navigation. Ridges, valleys, steps and straight lines in the land often reveal rock type and structure, such as a resistant sandstone forming a ridge or a fault forming a straight valley.
The language of the map is simple but precise. Once you can convert a scale, count contours and calculate a gradient, you can predict how hard a hike will be, where water will flow and how steep a road cut will need to be.
What you will learn
- How to read and convert map scale.
- What contour lines, interval, index contours and relief are.
- The rules of contour lines and how to spot hills, valleys, ridges and depressions.
- How to calculate gradient and slope angle, and draw a profile with vertical exaggeration.
Key terms
Scale is the ratio between a distance on the map and the real distance. A 1:24,000 map means 1 unit on the map is 24,000 of the same units on the ground.
Contour line is a line joining points of equal elevation.
Contour interval is the vertical distance between neighboring contour lines.
Relief is the difference in elevation between the highest and lowest points in an area.
Gradient is the change in elevation divided by the horizontal distance over which it occurs.
Map scale
Maps use three ways of showing scale. A representative fraction such as 1:24,000 states the ratio. A bar scale is a drawn ruler that stays correct if the map is enlarged or reduced. A verbal scale says "1 inch equals 2,000 feet". To convert, multiply the map distance by the scale denominator:
ground distance = map distance × scale denominator
On a 1:24,000 map, 1 cm is 24,000 cm = 240 m on the ground. A trail that measures 7.5 cm is 1,800 m long. The ratio of 1:24,000 is a large scale (more detail, small area), while 1:1,000,000 is a small scale (less detail, large area). It is the opposite of what the numbers suggest, because 1/24,000 is a larger fraction than 1/1,000,000.
Common scales: 1:24,000 is the US Geological Survey 7.5-minute quadrangle, 1:50,000 is standard across much of the world, and 1:100,000 gives a regional overview.
Contour lines
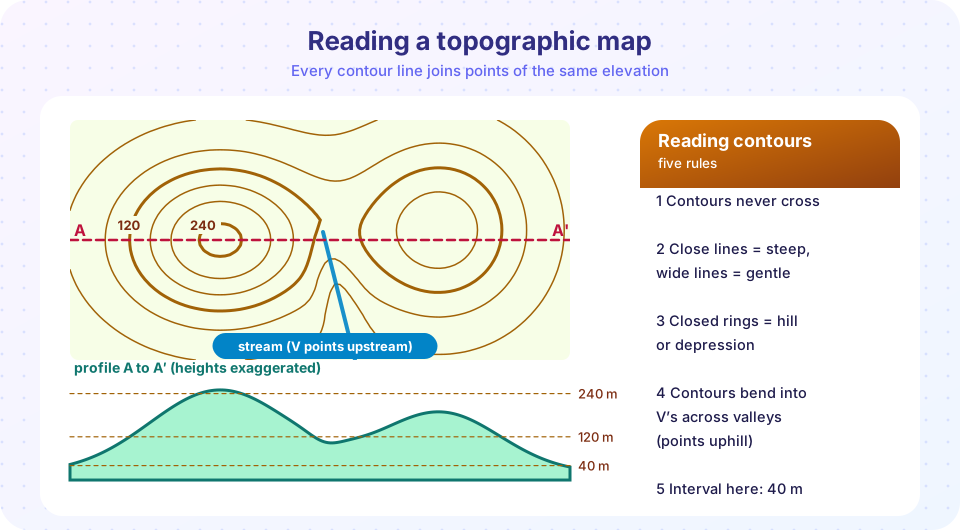
Imagine slicing a hill with horizontal planes at equal vertical steps, and drawing the outline of each cut on a map. Those outlines are the contour lines. The contour interval is chosen for the terrain: perhaps 5 m in flat country and 40 m in mountains. Every fifth line is usually an index contour, drawn thicker and labelled with its elevation.
Rules of contour lines
- Every point on one line has the same elevation.
- Contour lines never cross or merge, except at a vertical cliff or overhang, where they seem to touch.
- Every contour closes on itself, even if it leaves the edge of the map and returns on another sheet.
- Lines close together mean steep ground; lines far apart mean gentle ground. Evenly spaced lines mean a uniform slope.
- Closed rings surrounded by lower lines are hills; rings with short tick marks (hachures) pointing inward are depressions.
- Contours bend into V shapes where they cross a stream, and the V points upstream, toward higher ground, because a stream sits in a low channel. Along a ridge the contours form Vs pointing downhill, away from higher ground.
- Contours are perpendicular to the direction of steepest slope, so water runs at right angles across them.
Between two lines of different heights, you can estimate elevation by interpolation. A point halfway between the 120 m and 160 m contours is about 140 m high.
From contours to numbers
Gradient
gradient = rise / run = (elevation change) / (horizontal distance)
If you walk from 200 m to 280 m elevation while covering 1.6 km on the map, then gradient = 80 / 1600 = 0.05, or 5 percent, or 50 meters per kilometer. The slope angle is θ = arctan(0.05) = 2.9°. A road with a 10 percent grade climbs 10 m for every 100 m of horizontal distance, an angle of 5.7°. Percent grade and angle are not the same: a 100 percent grade is only 45°.
Slope from contour spacing
Use the contour interval and the spacing between lines to estimate steepness:
tan θ = contour interval / (spacing on map × scale denominator)
With a 10 m interval and lines 5 mm apart on a 1:24,000 map, the horizontal distance is 5 mm × 24,000 = 120 m, so tan θ = 10/120 and θ ≈ 4.8°. Halve the spacing and the slope roughly doubles.
Profiles and vertical exaggeration
A topographic profile is a side view along a chosen line. To draw one, mark where the line crosses each contour, plot the elevations against distance on graph paper, and connect the points. Because hills are small compared with their width, geologists often stretch the vertical scale. The vertical exaggeration is
VE = horizontal scale denominator / vertical scale denominator
If the horizontal scale is 1:24,000 and the vertical scale is 1:6,000, the vertical scale is four times larger, so VE = 24,000 / 6,000 = 4. Vertical features look four times steeper than they are. Always label the VE on a profile or section, because exaggeration distorts dips and slopes.
Coordinates and positions
Maps place points with a coordinate grid. Latitude and longitude are angles measured from the equator and the Prime Meridian. The Universal Transverse Mercator (UTM) grid divides the world into 60 north-south zones, each 6° of longitude wide, and gives positions in meters as an easting and a northing. UTM is convenient for geologists because distances are simply subtracted. GPS receivers give a position in either system, but they must be set to the same datum (a reference model of Earth, such as WGS 84) as the map. A wrong datum can shift positions by tens to hundreds of meters.
Reading geology from topography
Landforms hint at rocks and structures:
- Resistant rocks (sandstone, quartzite, igneous intrusions) form ridges and cliffs. Weak rocks (shale, evaporite) form valleys.
- Tilted layers of alternating hard and soft rocks make parallel ridges and valleys.
- A very straight valley or scarp may follow a fault or a joint set.
- Closed circular depressions in limestone country are sinkholes.
- Drainage patterns also reveal structure: dendritic (branching) in uniform rock, trellis in folded rock, radial around a volcano.
Common misconceptions
"Closer contours mean higher ground." They mean steeper ground. Height is read from labels.
"A large scale means a big area." It is the opposite: a large scale map shows a small area in detail.
"Percent grade and degrees are the same." 100 percent grade is 45°.
"A profile shows the true shape of the land." Only if the vertical exaggeration is 1.
Try it
Press Run (or Ctrl + Enter) to see the result here.
Program input · what you'd type while the program runs
Type the answers before you press Run, one per line. Each time the program reads a line (with input()), it gets the next line from this box.
Press Run (or Ctrl + Enter) to see the result here.
Program input · what you'd type while the program runs
Type the answers before you press Run, one per line. Each time the program reads a line (with input()), it gets the next line from this box.
Press Run (or Ctrl + Enter) to see the console output here.
No output.
Check your understanding
Quick check · 6 questions
of 6 answered You scored / 6 · perfect!
-
1. On a 1:50,000 map, 2 cm represents how far on the ground?
2 cm × 50,000 = 100,000 cm = 1,000 m. -
2. Where a stream crosses contour lines, the contours form V shapes that point:
Contours bend toward higher ground across a stream channel. -
3. Which map has the LARGEST scale?
1/24,000 is the largest fraction, so it shows the most detail. -
4. You climb 50 m over a horizontal distance of 500 m. The gradient is:
50 / 500 = 0.10, or 10 percent. -
5. A profile has VE = 3. A true 10° slope would look about:
Vertical exaggeration steepens apparent slopes. -
6. What do hachured closed contours show?
Hachures point toward the lower ground inside a depression.
Summary
- Scale converts map distance to ground distance: multiply by the denominator.
- Contour lines join equal elevations; close spacing means steep ground; V's point upstream.
- Gradient = rise / run; slope from contours:
tan θ = interval / (spacing × scale). - Profiles need a stated vertical exaggeration:
VE = horizontal denominator / vertical denominator. - Landforms and drainage patterns offer clues to rock type and structure.
Track your progress
Create a free account to tick off lessons and pick up where you left off on any device.
of Geology lessons completed