


















Lesson 7 of 48 · Properties and State
Phase Change of Pure Substances
Follow water as it is heated at constant pressure: compressed liquid, saturated liquid, mixture, saturated vapor and superheated vapor, with T-v diagrams, saturation temperature and the critical point.
Put a pot of water on a stove and watch. The temperature climbs steadily, then stops at 100 °C even though the burner keeps pouring in energy, and the water slowly turns to steam. Only when the last drop has gone does the temperature rise again. That simple kitchen experiment contains the whole vocabulary of phase change that engineers use to design boilers, condensers and refrigerators. This lesson walks through it step by step and puts it on a diagram.
What you will learn
- The names and meaning of compressed liquid, saturated liquid, saturated mixture, saturated vapor and superheated vapor.
- How saturation temperature and pressure depend on each other.
- What latent heat and the critical point are.
- How to read a
T-vdiagram and aP-Tphase diagram.
Key terms
Saturation temperature T_sat: the temperature at which a liquid boils at a given pressure.
Saturation pressure P_sat: the pressure at which a liquid boils at a given temperature.
Latent heat of vaporization h_fg: the energy needed to turn 1 kg of saturated liquid into saturated vapor at constant pressure.
Critical point: the end of the saturation curve, beyond which liquid and vapor are no longer distinct phases.
Heating water at constant pressure
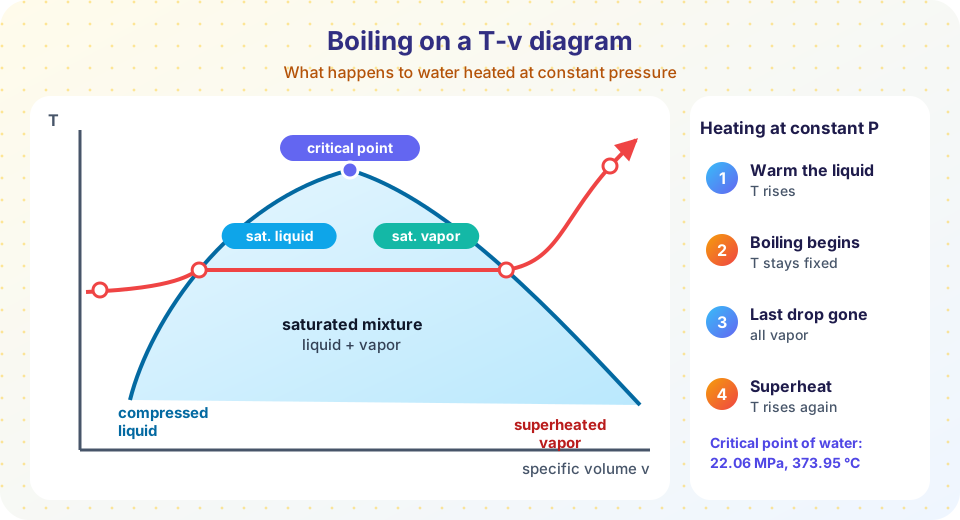
Imagine 1 kg of water at 20 °C in a cylinder with a freely moving piston that keeps the pressure at 101.325 kPa (1 atm). Add heat steadily and follow the states:
- Compressed (subcooled) liquid. The water is liquid and well below its boiling point at this pressure. Heat raises the temperature, and the volume grows only slightly. "Compressed" means the pressure is higher than the saturation pressure at that temperature, so it is not about to boil.
- Saturated liquid. At about 100 °C (99.97 °C at exactly 101.325 kPa) the liquid is on the verge of boiling. Any more heat makes some of it vaporize.
- Saturated liquid-vapor mixture. As heat continues, liquid turns to vapor while temperature stays at 100 °C. The volume rises dramatically. The energy goes into breaking the bonds between molecules, not into raising the temperature.
- Saturated vapor. The last drop vaporizes. The vapor is on the verge of condensing if any heat is removed.
- Superheated vapor. More heat raises the temperature again, and the vapor is now above the boiling temperature at its pressure.
The energy absorbed during step 3 for each kilogram is the latent heat of vaporization: about 2,257 kJ/kg at 100 kPa. Compare it with the 418 kJ needed to warm the liquid from 0 to 100 °C, and you see why steam stores so much energy and why condensing steam is such an effective heater.
Saturation temperature and pressure
At each pressure there is exactly one temperature where boiling happens, and vice versa. Here are rounded values for water:
| Pressure | T_sat |
Everyday example |
|---|---|---|
| 10 kPa | 45.8 °C | Power-plant condenser |
| 80 kPa | about 93.5 °C | Boiling in a city at 2,000 m |
| 101.325 kPa | 99.97 °C | Sea-level kettle |
| 200 kPa | 120.2 °C | Pressure-cooker interior (about 100 kPa gauge) |
| 1 MPa | 179.9 °C | Industrial steam line |
| 10 MPa | 311.0 °C | Boiler drum |
This explains why food cooks faster in a pressure cooker (the water cannot get hotter than T_sat, but T_sat is higher) and why it takes longer to boil an egg on a mountain (lower P, lower T_sat). It also explains why a power-plant condenser runs at a deep vacuum: condensing at 10 kPa allows steam to give up energy near 46 °C.
As pressure rises the latent heat decreases (about 2,257 kJ/kg at 100 kPa, 2,014 kJ/kg at 1 MPa, 1,318 kJ/kg at 10 MPa), and the specific volume jump between liquid and vapor shrinks.
The critical point and the dome
Plot the saturated liquid and saturated vapor states of water on a T-v diagram for many pressures and you get a dome. The left side is the saturated liquid line, the right side is the saturated vapor line, and they meet at the top: the critical point. For water this is 22.064 MPa and 373.95 °C, with a specific volume of about 0.003106 m³/kg.
- Inside the dome the substance is a saturated mixture.
- To the left lies compressed liquid; to the right (and above) lies superheated vapor.
- Above the critical pressure, heating a liquid takes it smoothly to a vapor-like fluid with no boiling and no distinct mixture phase. Supercritical steam power plants run in this region to reach higher efficiencies.
Notice how the liquid is almost incompressible: its specific volume at 100 kPa is v_f = 0.001043 m³/kg, but the vapor's is v_g = 1.694 m³/kg, about 1,600 times larger.
The P-T phase diagram
A P-T diagram shows three lines separating solid, liquid and vapor. They meet at the triple point, where all three phases coexist. For water: 0.01 °C and about 0.6117 kPa. The liquid-vapor line ends at the critical point. Below the triple-point pressure, ice turns directly into vapor (sublimation), as when frozen laundry dries in winter. One unusual feature of water is that its solid-liquid line leans slightly to the left: ice melts under high pressure, because ice is less dense than liquid water.
Common misconceptions
"Boiling water gets hotter if you turn up the heat." At fixed pressure the temperature stays at T_sat until all liquid is gone; more heat only makes more steam, faster.
"Steam is visible." True steam (vapor) is invisible. The white cloud above a kettle is tiny liquid droplets that have already condensed.
"Evaporation only happens at the boiling point." Liquids evaporate at any temperature from the surface; boiling is the special case of vapor bubbles forming inside the liquid when P_sat equals the surrounding pressure.
Try it
The first plot draws the saturation temperature of water against pressure (log scale) from rounded table values, marking the cooker and the mountain. The second plots the dome on a T-v diagram from table points and prints how much bigger the vapor volume is.
Press Run (or Ctrl + Enter) to see the result here.
Program input · what you'd type while the program runs
Type the answers before you press Run, one per line. Each time the program reads a line (with input()), it gets the next line from this box.
Press Run (or Ctrl + Enter) to see the result here.
Program input · what you'd type while the program runs
Type the answers before you press Run, one per line. Each time the program reads a line (with input()), it gets the next line from this box.
Check your understanding
Quick check · 5 questions
of 5 answered You scored / 5 · perfect!
-
1. While liquid water boils at constant pressure, its temperature
Added heat goes into latent heat of vaporization, so the temperature stays constant at T_sat. -
2. Water at 50 C and 500 kPa is
The saturation pressure at 50 C is only about 12 kPa. 500 kPa is far above it, so the water is compressed liquid. -
3. Why does a pressure cooker cook food faster?
At higher pressure T_sat is higher, so the water and food can reach a higher temperature before boiling. -
4. What is special about the critical point?
At the critical point the saturated liquid and vapor lines meet and the latent heat is zero. -
5. At 100 kPa, vf = 0.001043 and vg = 1.694 m3/kg. About how many times larger is the vapor volume?
1.694 / 0.001043 is about 1,624.
Summary
- Constant-pressure heating of water passes through compressed liquid, saturated liquid, mixture, saturated vapor and superheated vapor.
- During boiling
T = T_sat(P)stays fixed; the energy absorbed is the latent heath_fg. - Higher pressure means higher
T_satand smaller latent heat; at the critical point (22.064 MPa, 373.95 °C for water) the distinction vanishes. - The
T-vdome and theP-Tdiagram (with the triple point) organize all of this in pictures.
Next: Steam Tables and Quality
Track your progress
Create a free account to tick off lessons and pick up where you left off on any device.
of Engineering Thermodynamics lessons completed