


















Lesson 34 of 49 · Panel Data and Time Series
Chapter 7 overview: panel data and time series
A map of chapter 7: what panel data are, why following the same units over time helps, and why trending time series need special care.
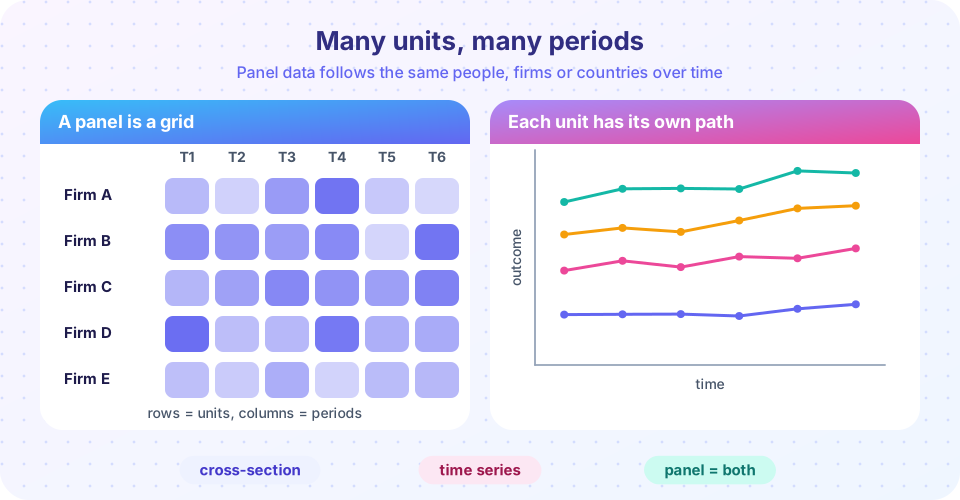
So far, our data have been a single snapshot: many people at one moment (a cross-section), or one economy through time with little thought for its dynamics. Two richer structures dominate applied work. Panel data follow the same units, people, firms, regions or countries, over several periods. Time series follow one unit (or a small number) over a long stretch, and what matters most is how today relates to yesterday.
These structures offer big opportunities and big traps. Panels let you control for everything about a unit that does not change over time, even things you cannot measure. Time series let you study dynamics, persistence and forecasting, but they carry a danger that cross-sections do not: two unrelated trending series can appear to be tightly linked, and ordinary t statistics lie. This chapter equips you for both.
What you will learn
- The vocabulary of panel data: balanced and unbalanced, within and between variation, long and wide format.
- Why unobserved, time-invariant heterogeneity biases pooled OLS and how a panel can remove it.
- Why stationarity is the key concept for time series, and what a unit root does.
- How cointegration rescues regressions among trending series.
Key terms
Panel (longitudinal) data: observations on N units over T periods, indexed it. Balanced panel: every unit observed in every period. Within variation: change in a variable over time for the same unit. Between variation: differences across units. Stationary series: its mean, variance and autocovariances do not depend on time. Unit root: a series with a persistent, random-walk-like component.
The chapter in five slides
Panel data
The hidden-trait problem
Two panel models
Time series
Danger and cure
Panel data in one paragraph
Imagine tracking 500 firms for ten years and regressing profit on advertising spending. A pooled regression compares high-advertising firms with low-advertising firms, but firms differ in ways you cannot measure: management quality, brand strength, local market. If better-managed firms both advertise more and earn more, pooled OLS overstates the effect of advertising. A fixed-effects estimator compares each firm only with itself in other years: did profit rise in the years when this firm advertised more? Everything stable about the firm cancels. You pay with a loss of variation, since only the changes within a firm drive the estimate, and with the inability to estimate the effect of anything that does not change within a firm.
Time series in one paragraph
Take the price level of a country over fifty years, and the number of mobile phone subscriptions in the same country. Both trend upward. Regress one on the other: you will find a high R² and a "significant" slope, even though there is no connection. The two series are not stationary. Their means change over time and their shocks accumulate. Ordinary t tests assume a stationary world, so they are unreliable here. This is the classical spurious regression problem of Granger and Newbold (1974). The remedy is to test for unit roots, difference the data when needed, and exploit cointegration when series do share a stable long-run relationship.
Between and within variation
A panel variable varies in two ways. The code below builds a small invented panel and splits the variance of a regressor into its between part (differences in unit averages) and its within part (deviations from each unit's own average). Fixed effects uses only the second part.
Press Run (or Ctrl + Enter) to see the result here.
Program input · what you'd type while the program runs
Type the answers before you press Run, one per line. Each time the program reads a line (with input()), it gets the next line from this box.
Fixed effects discards the between part. When most of the variation is between units, the within estimator works with much less information, so its standard errors grow.
A first spurious regression
The next experiment draws two independent random walks, which have no relationship by construction, and regresses one on the other. Count how often the usual t test declares "significance".
Press Run (or Ctrl + Enter) to see the result here.
Program input · what you'd type while the program runs
Type the answers before you press Run, one per line. Each time the program reads a line (with input()), it gets the next line from this box.
If the test were valid, 5% of the slopes would be significant. Instead a large majority are, and the R² is often far from zero. This simulation is the best argument for the unit-root machinery of lesson 3.
What each lesson covers
- Fixed and random effects: the within transformation, the least-squares dummy variable view, random effects and the Hausman test.
- Stationarity and unit roots: what stationarity means, the random walk, ADF testing and differencing.
- Cointegration and forecasting: spurious regression, the Engle-Granger test, error correction and a first ARIMA-style forecast.
- Chapter review: one picture and ten quiz questions.
Common misconceptions
"More periods always help." For panels with fixed effects, extra periods help only if the regressors change within units. For time series, long samples help only if the series are stationary (or cointegrated).
"A high R² in a time series regression means a good model." With trending data, a high R² can be pure coincidence.
Check your understanding
Quick check · 4 questions
of 4 answered You scored / 4 · perfect!
-
1. In panel data, within variation refers to...
Within variation is how a variable moves around its own unit's average. -
2. Why can a panel help with unobserved traits?
A trait that does not change over time cancels when you compare a unit with itself. -
3. Two independent random walks are regressed on each other. The usual t test will...
Nonstationary series violate the assumptions behind the t distribution, producing spurious significance. -
4. A stationary series is one whose...
Stability of the first and second moments is the definition used in practice (weak stationarity).
Summary
- Panel data observe
Nunits overTperiods; fixed effects use within variation and remove time-invariant unobserved traits. - Time series demand stationarity; unit roots break the standard t test and can create spurious regressions.
- Cointegration describes a stable long-run link between nonstationary series.
- Always ask which source of variation drives your estimate.
Next: Fixed and random effects
Track your progress
Create a free account to tick off lessons and pick up where you left off on any device.
of Econometrics lessons completed