


















Lesson 22 of 49 · Inference and Specification
Chapter 4 review: inference and specification
Review chapter 4 of econometrics: classical assumptions, standard errors, t and F tests, confidence intervals, omitted variable bias and multicollinearity, with a recap table and a ten-question quiz.
You can now do more than fit a line: you can say how much to trust it. This chapter gave you the assumptions behind OLS, the tools for testing hypotheses about one or several coefficients, and a checklist of specification problems that threaten an estimate. Chapter 5 will relax two assumptions (homoskedasticity and independence); Chapter 6 will tackle the hardest one (exogeneity).
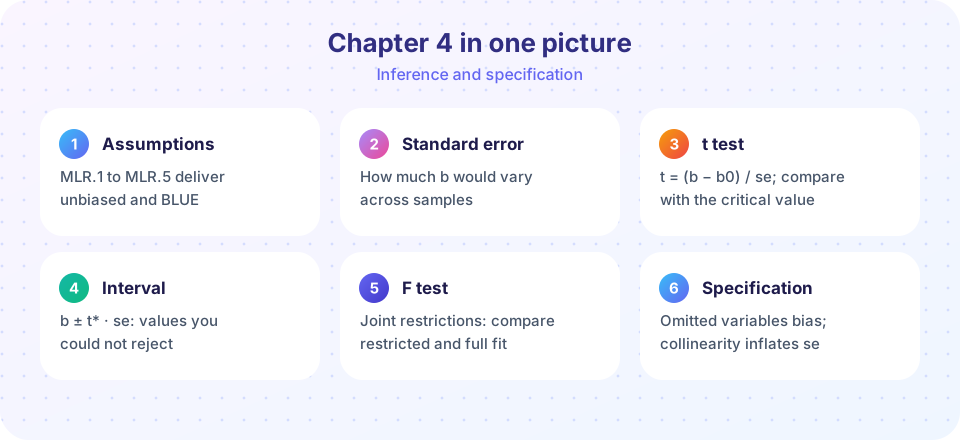
The chapter in one table
| Topic | Key facts |
|---|---|
| Assumptions | MLR.1 linear, MLR.2 random sample, MLR.3 no perfect collinearity, MLR.4 E[u | x] = 0, MLR.5 homoskedasticity, MLR.6 normal errors |
| Properties | MLR.1 to 4: unbiased. MLR.1 to 5: BLUE (Gauss-Markov). MLR.1 to 6: exact t and F |
| Variance | Var(b1) = σ²/Σ(x − x̄)²; σ̂² = RSS/(n − k − 1); se(b1) = σ̂/√Σ(x − x̄)² |
| t test | t = (bj − c)/se(bj); reject if ` |
| p-value | Probability, under H0, of a statistic at least as extreme; not the probability that H0 is true |
| Interval | bj ± t*·se(bj); contains exactly the nulls a two-sided test fails to reject |
| F test | F = [(SSRr − SSRur)/q]/[SSRur/(n − k − 1)]; for q = 1, F = t² |
| Omitted variable bias | E[b̃1] = β1 + β2·δ1; sign it with the sign table |
| Multicollinearity | VIF = 1/(1 − Rj²); inflates variance, not bias |
| Measurement error | Error in a regressor attenuates the slope by the reliability ratio |
How to think about a regression result
When you read (or write) a regression table, run through a checklist.
- What is the estimate? State it with units and in the comparison it describes.
- How precise is it? Look at the standard error and the confidence interval, not only the stars.
- Is it statistically distinguishable from the relevant benchmark? The t statistic or p-value answers this for a single coefficient; the F test for several.
- Is it big enough to matter? Economic significance is a judgment about size.
- Could it be biased? Think about what is in the error term and whether it moves with the regressor. Sign the likely bias.
- Would it survive a different specification? Check robustness to adding sensible controls, changing the functional form and dropping outliers.
Notice that steps 1 to 4 are about sampling noise and step 5 is about the design. A beautiful standard error cannot rescue a biased estimate.
Common mistakes to avoid
Treating "not significant" as "no effect". Check the interval and the sample size.
Reading p-values as the probability that the null is true.
Using individual t tests when the question is joint. Use an F test.
Fixing collinearity by dropping a relevant variable. You swap imprecision for bias.
Thinking a large sample cures bias. It does not.
Try it
First, a compact function that takes any fitted regression's pieces and produces a full results table with estimates, standard errors, t statistics, p-values and intervals, the numbers you see in every published regression table. It is a good way to check you understand each column.
Press Run (or Ctrl + Enter) to see the result here.
Program input · what you'd type while the program runs
Type the answers before you press Run, one per line. Each time the program reads a line (with input()), it gets the next line from this box.
Second, a visual summary of how the pieces trade off: the width of a 95% interval for a slope as sample size grows, for two levels of noise.
Press Run (or Ctrl + Enter) to see the result here.
Program input · what you'd type while the program runs
Type the answers before you press Run, one per line. Each time the program reads a line (with input()), it gets the next line from this box.
Check your understanding
Quick check · 10 questions
of 10 answered You scored / 10 · perfect!
-
1. OLS is unbiased under which set of assumptions?
Linearity, random sampling, no perfect collinearity and zero conditional mean deliver unbiasedness. -
2. Which assumption does the Gauss-Markov theorem add to MLR.1 to MLR.4 to conclude OLS is BLUE?
BLUE requires MLR.5, constant error variance. -
3. If b = 2.4, se = 0.8 and df is large, the t statistic for H0: β = 0 is
2.4/0.8 = 3.0, which exceeds about 1.96. -
4. A 95% confidence interval for a coefficient is (0.10, 0.90). A two-sided 5% test of H0: β = 0.5 would
0.5 lies inside the interval, so it is not rejected. -
5. What does a p-value of 0.03 mean?
A p-value is a probability about the data given the null. -
6. A joint test of two restrictions in a model with 60 observations and 5 regressors uses degrees of freedom
q = 2 and n − k − 1 = 60 − 5 − 1 = 54. -
7. In a regression of wages on schooling, omitted ability that is positively related to both schooling and wages causes
β2 > 0 and δ1 > 0 give a positive bias. -
8. Multicollinearity between two controls and the regressor of interest being uncorrelated with them means
Collinearity among controls inflates only their own variances; the regressor of interest keeps its precision. -
9. If the reliability ratio of a noisily measured regressor is 0.6 and the true slope is 3, the OLS slope will be about
Attenuation multiplies the slope by the reliability ratio: 0.6 × 3 = 1.8. -
10. Which is a good reason NOT to control for a variable?
Controlling for a mediator removes part of the effect you want to measure.
Summary
- MLR.1 to MLR.4 give unbiasedness; MLR.5 gives Gauss-Markov efficiency and the usual standard errors; MLR.6 gives exact t and F tests.
- Use t tests and confidence intervals for one coefficient, F tests for joint hypotheses, and always report the size of the estimate.
- Omitted variable bias is
β2·δ1; multicollinearity inflates variance, not bias; measurement error attenuates slopes. - Standard errors describe sampling noise and cannot cure a biased specification.
- Chapter 5 asks what happens when errors have unequal variance or are correlated with each other.
Track your progress
Create a free account to tick off lessons and pick up where you left off on any device.
of Econometrics lessons completed