


















Lesson 6 of 49 · Data and the Regression Idea
Chapter 2 overview: data and the regression idea
Preview chapter 2 of econometrics: random variables, expectation and variance, the conditional expectation function and estimators with sampling distributions, and why regression builds on them.
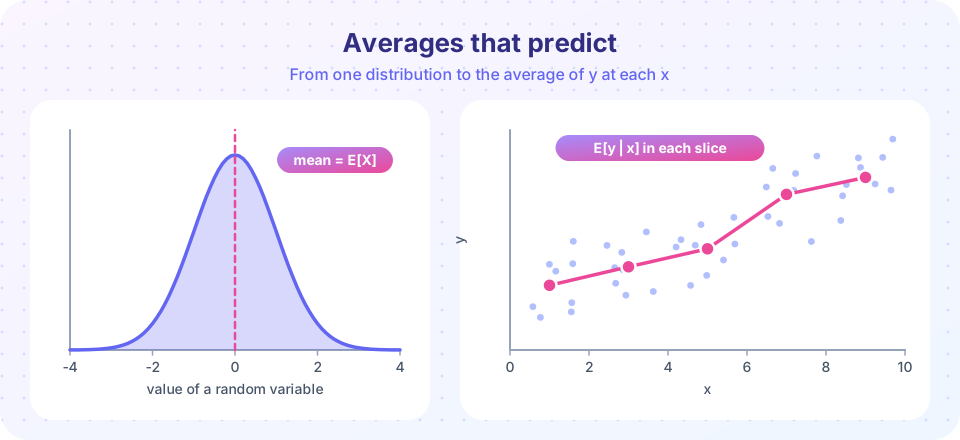
A regression line looks like a drawing tool: place a ruler through a cloud of dots. Behind that picture is a precise idea from probability. When you ask "what wage should I expect for someone with 16 years of schooling?", you are asking for an average, the average of all possible wages among people with 16 years of schooling. Regression is a method for estimating such averages from a sample.
This chapter builds the three ideas that make that sentence precise: how to describe a random quantity (expectation, variance, covariance), what the average of y given x means and why it is the best prediction, and how an estimate computed from one sample relates to an unknown truth. Nothing here is hard individually; together they are the foundation of everything that follows.
What you will learn
- Why regression is about conditional averages.
- What each lesson in this chapter covers and how they connect.
- How to prepare: the few probability facts you will use over and over.
Key terms
Random variable: a quantity whose value is determined by chance, such as the wage of a randomly chosen worker.
Expectation (mean): the long-run average value of a random variable.
Conditional expectation: the average of one variable given that another takes a particular value.
Estimator: a rule for computing a guess of an unknown quantity from a sample.
The chapter at a glance
Randomness has a shape
Averages that predict
From sample to truth
What each lesson covers
- Probability and expectation review refreshes the tools: random variables, expectation, variance, covariance, correlation and the normal distribution, with worked examples and a simulation.
- The conditional expectation function introduces
E[y | x], shows that it is the best predictor ofygivenx, and explains how a straight-line regression approximates it. - Estimators and sampling distributions explains why estimates change from sample to sample, how to judge an estimator by bias, variance and consistency, and what the standard error measures.
- Chapter 2 review summarizes the chapter and tests all three lessons with ten questions.
Why this comes before regression
Many beginners start with the formula for the slope and treat it as a recipe. That works until the first time something goes wrong: the slope has the wrong sign, the standard error is huge, or a colleague asks "what are you actually estimating?" Then you need the foundations. A regression coefficient is an estimate of a feature of a population. That sentence has three words doing real work: estimate (Lesson 3), feature of a population (Lesson 2), and the language to describe a population (Lesson 1).
The order also mirrors how research goes. You decide what quantity you want (a conditional average), you collect a sample, you compute an estimator, and you reason about how far that estimate might be from the truth.
Common misconceptions
"The sample is the population." A sample is a small, random slice of the population. Any number computed from it is an estimate that would change if you drew another slice.
"Averages are boring." Almost everything in econometrics is an average or a function of averages: slopes, effects, forecasts. Understanding conditional averages deeply is understanding regression.
Try it
A warm-up that previews Lesson 2. We simulate 500 workers and compute the average wage in each schooling group by hand, before any regression. Notice that the group averages rise roughly in a straight line.
Press Run (or Ctrl + Enter) to see the result here.
Program input · what you'd type while the program runs
Type the answers before you press Run, one per line. Each time the program reads a line (with input()), it gets the next line from this box.
A second warm-up previews Lesson 3. We draw many samples from the same population and watch the sample mean vary, a small simulation of a sampling distribution.
Press Run (or Ctrl + Enter) to see the result here.
Program input · what you'd type while the program runs
Type the answers before you press Run, one per line. Each time the program reads a line (with input()), it gets the next line from this box.
Check your understanding
Quick check · 4 questions
of 4 answered You scored / 4 · perfect!
-
1. A regression of wage on schooling mainly estimates
Regression approximates the conditional expectation of the outcome given the explanatory variables. -
2. Which concept describes how estimates vary across different samples?
The sampling distribution is the distribution of an estimator over repeated samples. -
3. Why does this chapter come before the regression chapter?
The ideas of expectation, conditional expectation and estimators are what a regression coefficient is built from. -
4. Quadrupling a sample size changes the standard deviation of the sample mean by what factor?
The standard deviation of the sample mean is σ divided by the square root of n, and the square root of 4 is 2.
Summary
- Regression estimates conditional averages: the average of
yfor given values ofx. - The chapter covers random variables and their summaries, the conditional expectation function, and estimators with their sampling distributions.
- Every sample statistic is itself random: it would differ in another sample.
- Understanding these ideas prevents the most common misreadings of regression output.
Track your progress
Create a free account to tick off lessons and pick up where you left off on any device.
of Econometrics lessons completed