


















Lesson 24 of 49 · Violations: Heteroskedasticity and Autocorrelation
What heteroskedasticity is
Learn what heteroskedasticity means, where it comes from in economic data, why OLS slopes survive it, and exactly which results it ruins.
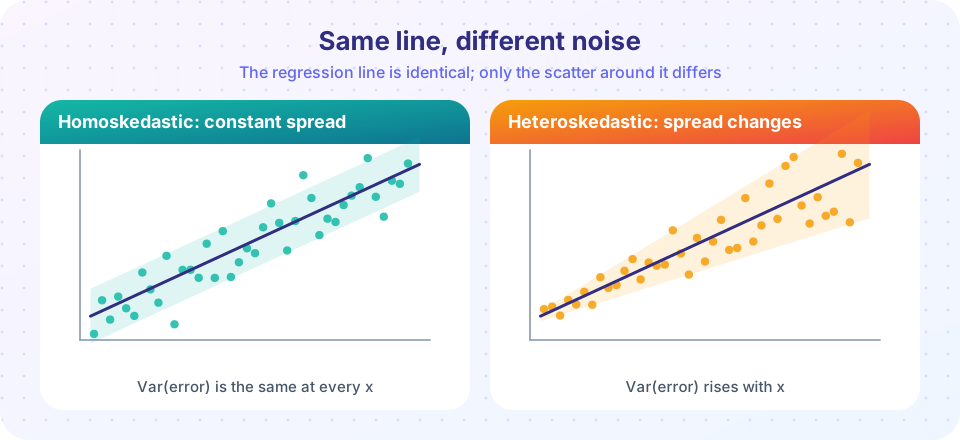
Suppose you regress household food spending on household income. A family earning very little has almost no room to choose: most of its budget goes to the basics, and two such families spend nearly the same amount. A family earning a great deal can spend a little on food or a lot, depending on taste, how often it dines out and whether it entertains. If you plot spending against income, the points form a funnel: narrow at the low-income end, wide at the high-income end. The line through the middle may be perfectly fine. The scatter around it is not constant.
That funnel shape has a name. The error term has heteroskedasticity when its variance depends on the values of the regressors. This lesson explains where it comes from, what it does to your regression and what it does not do.
What you will learn
- The formal definition of homoskedasticity and heteroskedasticity.
- Four common sources of uneven variance in economic data.
- Which properties of OLS survive, and which do not.
- How to see the problem in a residual plot.
Key terms
Homoskedasticity: Var(u | x) = σ² for every observation. Heteroskedasticity: Var(u | x) = σi², which changes with the regressors. Residual: the observed y minus the fitted value, e = y − ŷ, our estimate of the unobservable error u. BLUE: best linear unbiased estimator. Efficiency: having the smallest variance among a class of estimators.
The definition
The classical assumption is that the error variance is the same for every observation, whatever the value of the regressors:
Var(ui | x1i, ..., xki) = σ²
When this fails we write Var(ui | xi) = σi², with a subscript to show that each observation can have its own variance. Two things deserve attention. First, the condition is about the conditional variance of the error. The raw variance of y always differs across people. What matters is whether the spread of y around its own conditional mean is uniform. Second, heteroskedasticity is about the error, not the regressor. A regressor with a wide range is no problem at all.
Where it comes from
Uneven variance is not an exotic accident; it is the natural state of much economic data. Four common sources:
- Scale effects. Big units have big fluctuations. A large company's annual profit moves by millions; a corner shop's moves by thousands. Regressions of levels (profit, spending, output) on size variables nearly always show a funnel.
- Averaged data. If each observation is a city average computed from a different number of residents, the average of a large city is estimated more precisely than that of a small town. The variance of the error is then inversely related to group size:
σi² = σ² / ni. - Learning and heterogeneity. People differ in how predictable they are. Experienced typists make few errors, novices make many; as practice increases the error variance shrinks.
- Misspecification and outliers. Omitting a variable, using the wrong functional form (a level where a logarithm belongs) or including a few extreme observations can all produce a pattern that looks like heteroskedasticity. This is why plotting precedes testing.
A useful rule of thumb: when the dependent variable is positive and spans several orders of magnitude, expect the variance to grow with its mean. Taking logarithms often tames this, which is one reason log wage regressions are the default in labour economics.
What heteroskedasticity does not do
Recall the argument that OLS is unbiased. It uses only the assumption E(u | x) = 0. Nothing in that derivation refers to the variance. Therefore:
- The OLS slopes remain unbiased and consistent under heteroskedasticity.
- The R² still measures the share of variation explained, and the fitted line is still a sensible summary of how the conditional mean moves with
x.
If a reader tells you "your coefficient is biased because you have heteroskedasticity", the correct reply is that they are confusing bias with variance. Bias would come from an omitted variable or measurement error, topics of chapter 6.
What heteroskedasticity does
Three things break.
The usual variance formula is wrong. In simple regression, the true variance of the slope is
Var(b1) = Σ (xi − x̄)² σi² / [Σ (xi − x̄)²]²
whereas the usual software formula, built on one common σ², reports σ̂² / Σ (xi − x̄)². The two agree only when all the σi² are equal. When the large-variance observations are exactly the ones with the most leverage (the points far from x̄), the true variance is larger than the formula says, and your standard errors are too small.
Tests and intervals lose their stated properties. A t statistic built on the wrong standard error does not follow the t distribution, even in large samples. A "95% interval" may cover the true value much less often than 95% of the time. The F test for joint hypotheses suffers the same way.
OLS is no longer efficient. The Gauss-Markov theorem needs constant variance. With uneven variance there is a better linear unbiased estimator: weighted least squares, which gives less weight to the noisy observations. We will meet it in the lesson on robust errors and WLS.
Seeing it: the residual plot
The first diagnostic is not a test but a picture. After fitting the regression, plot the residuals (or their absolute value, or their square) against the fitted values and against each regressor. A random horizontal band is reassuring. A funnel opening to the right, a funnel opening to the left, or a curve all deserve attention.
Press Run (or Ctrl + Enter) to see the result here.
Program input · what you'd type while the program runs
Type the answers before you press Run, one per line. Each time the program reads a line (with input()), it gets the next line from this box.
The data are invented to teach the shape. In the right panel the residuals are tightly packed on the left and widely spread on the right.
Usual versus robust standard errors
How much does the funnel matter for the slope? Compare the usual standard error with a heteroskedasticity-robust one on the same data. The robust formula (the "sandwich") replaces the common σ² with the squared residual of each observation; you will derive it carefully in a later lesson.
Press Run (or Ctrl + Enter) to see the result here.
Program input · what you'd type while the program runs
Type the answers before you press Run, one per line. Each time the program reads a line (with input()), it gets the next line from this box.
The slope is identical by construction. Only the measure of uncertainty changes, and in funnel-shaped data the robust standard error is typically larger.
Common misconceptions
"Heteroskedasticity means my regressor has a wide range." No. It is about the variance of the error given the regressor.
"Heteroskedasticity makes OLS biased." No. It leaves the slopes unbiased and makes the usual standard errors invalid.
"A funnel in the residual plot proves heteroskedasticity." A funnel is strong evidence, but a missing variable or a wrong functional form can produce one. Check the specification too.
Check your understanding
Quick check · 5 questions
of 5 answered You scored / 5 · perfect!
-
1. Which statement defines heteroskedasticity?
Heteroskedasticity means the conditional variance of the error changes from observation to observation, typically with the regressors. -
2. Under heteroskedasticity, OLS slope estimates are...
Unbiasedness requires only E(u|x) = 0, which heteroskedasticity does not violate. -
3. Which situation is a likely source of uneven error variance?
School averages based on different numbers of students have different precision, so the error variance differs across schools. -
4. The Gauss-Markov theorem no longer guarantees that OLS is best because...
BLUE requires homoskedasticity. With uneven variance, weighted least squares can have a smaller variance. -
5. A residual plot shows a funnel opening to the right. What is the best first reaction?
A funnel suggests unequal variance. First ask whether a log transformation or a missing variable explains it, then repair inference.
Summary
- Heteroskedasticity means
Var(u | x)is not constant; typical sources are scale, averaged data, heterogeneity and misspecification. - OLS slopes stay unbiased and consistent.
- The usual standard errors, t tests, F tests and intervals become invalid, and OLS stops being the most efficient linear estimator.
- A residual plot is the first and best diagnostic.
Track your progress
Create a free account to tick off lessons and pick up where you left off on any device.
of Econometrics lessons completed