


















Lesson 5 of 49 · Getting Started
Chapter 1 review: getting started
Review the first chapter of econometrics: the three ingredients, models, data structures, variable types and exploration routine, with a recap table and a ten-question quiz.
You have now seen what econometrics is for, how a model packages an economic idea into an equation, what shapes economic data take and how to look at a data set before modeling it. This review pulls those threads into one picture, gives you a recap table and tests you with a longer quiz that mixes all four lessons.
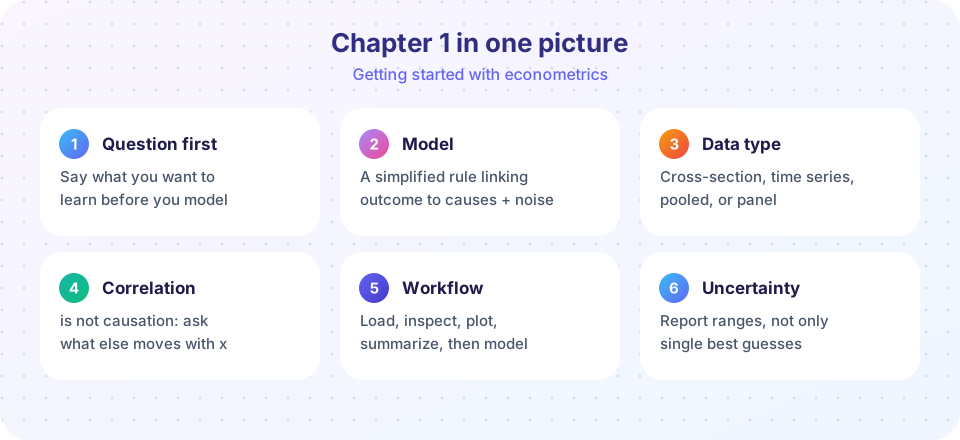
The chapter in one table
| Lesson | Core idea | Remember |
|---|---|---|
| Course map | Nine chapters in three arcs; study by predicting then running code | Interpretation, precision and identification are three different questions |
| What is econometrics? | Theory, data and statistics combine to measure relationships | A model is a purposeful simplification; u holds everything left out |
| Data types and variables | Cross-section, time series, pooled sections, panel | The structure decides which methods are valid |
| A first look at data | Inspect, summarize, plot, check relationships | Always plot; correlation is only linear |
Three ideas to carry forward
1. A good question comes first. "Does schooling matter?" is a topic. "By how much do hourly wages change with one additional year of schooling for full-time workers aged 25 to 54?" is a question you can answer. Writing the precise question tells you which data you need and what a good answer looks like.
2. The model separates what you include from what you leave out. In wage = β0 + β1·educ + u, the error term u holds ability, experience and luck. Everything that follows in this course is about when leaving u alone is harmless and when it ruins your estimate. If something in u is correlated with schooling, comparing wages across schooling levels mixes the effect of schooling with the effect of that hidden factor.
3. Data structure and data quality limit what you can learn. No method can recover information that is not in the data. A single cross section cannot tell you how one person's wage changes after training; a panel can. A column of codes full of hidden missing values cannot be rescued by clever modeling.
Common mistakes to avoid
Modeling before looking. Running a regression on data you have not plotted invites errors from outliers, miscoded values and nonlinear patterns.
Treating a correlation as an effect. A correlation tells you two variables move together. Decide on the causal story only after thinking about confounders.
Confusing precision with truth. A tiny standard error on a biased estimate gives you a confident wrong answer.
Try it
First, a small calculator that applies the exploration routine to a list of numbers you can edit. Change the data and watch the mean, the median and the standard deviation respond to an outlier.
Press Run (or Ctrl + Enter) to see the result here.
Program input · what you'd type while the program runs
Type the answers before you press Run, one per line. Each time the program reads a line (with input()), it gets the next line from this box.
Second, a plot that reviews the whole chapter idea: a model with a deterministic part (the line) and a random part (the scatter around it). The same rule generates every sample; only the noise differs.
Press Run (or Ctrl + Enter) to see the result here.
Program input · what you'd type while the program runs
Type the answers before you press Run, one per line. Each time the program reads a line (with input()), it gets the next line from this box.
Check your understanding
Quick check · 10 questions
of 10 answered You scored / 10 · perfect!
-
1. Which of the following is a precise empirical question?
A precise question names the outcome, the explanatory variable, the population and the measure of effect. -
2. In wage = β0 + β1·educ + u, which symbol is the parameter of main interest?
β1 is the change in wage per one-unit change in schooling. -
3. Four hundred different households are interviewed in 2012 and a different 500 in 2022. The data are
Different units appear in each period, so there is no follow-up of the same units. -
4. Why can a panel control for unobserved traits that never change?
Within-unit changes difference out anything constant about the unit. -
5. The mean of a 0/1 variable is
Summing the ones and dividing by the count gives the share equal to one. -
6. If the mean wage is well above the median wage, the distribution is probably
A few high values stretch the right tail and raise the mean more than the median. -
7. Which statement about correlation is correct?
Correlation captures linear association only, is sensitive to extremes and says nothing about causation. -
8. A naive comparison of degree holders and others overstates the true effect of a degree in our simulation because
Ability raises wages and also raises the chance of getting a degree, so the groups differ in more than the degree. -
9. Why do economists prefer data in real (inflation-adjusted) terms when comparing years?
Deflating isolates real changes in purchasing power from changes in the price level. -
10. What is the best first step with a new data set?
Exploration reveals errors, outliers and shapes before they can mislead a model.
Summary
- Econometrics combines theory, data and statistics to measure and test economic relationships.
- Models simplify; the error term holds everything left out, and the credibility of an estimate depends on whether what is left out is related to what you include.
- The four data structures are cross-section, time series, pooled cross sections and panel, each with its own strengths.
- Explore data first: inspect, summarize, plot and check relationships.
- Chapter 2 supplies the probability tools (expectation, variance, conditional expectation) that regression is built on.
Track your progress
Create a free account to tick off lessons and pick up where you left off on any device.
of Econometrics lessons completed