


















Lesson 10 of 49 · Data and the Regression Idea
Chapter 2 review: data and the regression idea
Review chapter 2 of econometrics: expectation, variance, covariance, the conditional expectation function and estimators, with a recap table and a ten-question quiz.
This chapter built the language in which regression is written. You described random quantities with expectation, variance and covariance. You met the conditional expectation function as the best predictor of an outcome given other variables. And you saw that every number computed from a sample is an estimate with its own sampling distribution. Chapter 3 now puts these pieces to work in the least squares line.
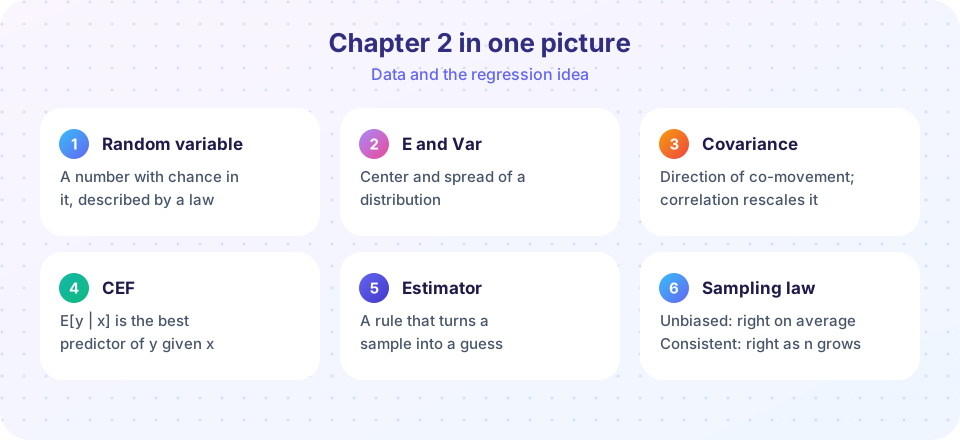
The chapter in one table
| Idea | Formula or statement | Why it matters later |
|---|---|---|
| Expectation | E[X] = Σ x·p(x); E[aX + b] = aE[X] + b |
Unbiasedness proofs use linearity |
| Variance | Var(X) = E[(X − μ)²]; Var(aX + b) = a²Var(X) |
Standard errors are square roots of variances |
| Covariance | Cov(X, Y) = E[(X − μX)(Y − μY)] |
The OLS slope is Cov(x, y)/Var(x) |
| Correlation | Cov(X, Y)/(σXσY), in [−1, 1] |
Unit-free linear association |
| CEF | m(x) = E[y | x]; y = m(x) + ε, E[ε | x] = 0 |
Regression estimates it |
| LIE | E[y] = E[E[y | x]] |
Used in most proofs |
| Estimator | Random before sampling; estimate is a number | Coefficients are estimators |
| Standard error | σ/√n for the mean |
Basis of tests and intervals |
| CLT | Means are approximately normal for large n | Why t and F tests work |
Key messages
Regression is about averages. When we regress wage on schooling we estimate the average wage at each schooling level, or the best straight-line approximation to those averages. We do not predict an individual's wage exactly; the error term ε records what the average cannot explain.
Descriptive is not causal. The CEF compares groups as they exist. Whether a difference in the CEF reflects an effect of x depends on whether the groups are otherwise comparable. Keep this firmly in mind through Chapter 4.
Estimates wobble. The sample mean, a regression slope and a correlation coefficient all change from sample to sample. Statistical inference quantifies that wobble. The standard error shrinks like 1/√n, which is why precise estimates require so much data.
Common mistakes to avoid
Adding variances without covariances. Var(X + Y) needs the 2·Cov(X, Y) term unless the variables are uncorrelated.
Reading a conditional average as a personal prediction. It is the center of the group's distribution, not a guarantee for any member.
Confusing standard deviation with standard error. One describes spread in the data, the other spread in the estimate.
Believing bias is the only problem. Consistency, variance and the question being asked all matter.
Try it
First, a quick check of two chapter-2 rules at once using simulation: that Var(X + Y) includes the covariance, and that the law of iterated expectations holds. Compare each pair of numbers.
Press Run (or Ctrl + Enter) to see the result here.
Program input · what you'd type while the program runs
Type the answers before you press Run, one per line. Each time the program reads a line (with input()), it gets the next line from this box.
Second, a visual review: how the width of the sampling distribution depends on both the sample size and how noisy the data are.
Press Run (or Ctrl + Enter) to see the result here.
Program input · what you'd type while the program runs
Type the answers before you press Run, one per line. Each time the program reads a line (with input()), it gets the next line from this box.
Check your understanding
Quick check · 10 questions
of 10 answered You scored / 10 · perfect!
-
1. If E[X] = 5 and E[Y] = 8, then E[2X − Y] equals
By linearity, 2·5 − 8 = 2. -
2. Var(X) = 9 and Var(Y) = 16 with Cov(X, Y) = 6. What is Var(X + Y)?
9 + 16 + 2·6 = 37. -
3. The best predictor of y given x in mean squared error is
No function of x has a smaller mean squared error than E[y | x]. -
4. If the CEF is curved, a regression of y on x estimates
OLS targets the least-squares line, which approximates the CEF. -
5. Four groups have equal size and average wages 10, 14, 18 and 22. By the law of iterated expectations the overall average wage is
The average of the group averages is (10 + 14 + 18 + 22)/4 = 16. -
6. An estimator is consistent when
Consistency is about large-sample convergence, not about small-sample bias. -
7. If σ = 20, the standard error of the mean for n = 100 is
20 / √100 = 2. -
8. The central limit theorem is most useful because it tells us that
It justifies normal-based inference for averages and, later, regression coefficients. -
9. Zero covariance between X and Y implies
Covariance only captures linear co-movement. -
10. Why do we divide the sample variance by n − 1?
Deviations from X̄ are smaller than deviations from μ, so dividing by n understates the variance.
Summary
- Expectation is linear; variance of a sum needs the covariance; the normal distribution follows the 68-95-99.7 rule.
- The CEF
E[y | x]is the best predictor ofy, and regression approximates it. - Estimates vary from sample to sample; the standard error measures how much, and it falls as
1/√n. - Judge estimators by bias, variance and consistency, and use the CLT for approximate normality.
- Chapter 3 will estimate the best line, the OLS fit, and show how to read and judge it.
Track your progress
Create a free account to tick off lessons and pick up where you left off on any device.
of Econometrics lessons completed