


















Lesson 1 of 49 · Getting Started
Course map: how this econometrics course works
See the whole econometrics course at a glance: who it is for, what you need first, how the nine chapters fit together and how to study them with runnable Python.
Economists, data analysts, policy researchers and business strategists all ask the same kind of question: how much does one thing change when another thing changes, and how sure are we? Does an extra year of school raise wages, and by how much? Does a price cut sell more coffee, or only shift sales between weeks? Did a new minimum wage reduce jobs? Econometrics is the toolkit for answering such questions from data without fooling yourself.
This course takes you from "what is a regression?" to the methods that professional researchers use to estimate causal effects. Every idea is shown with a picture, a small worked example and code you can run in your browser. You do not install anything.
What you will learn
- How the nine chapters build on each other, and where each tool fits in a real analysis.
- What background you need and how to fill small gaps as you go.
- How every lesson is laid out, so you can study efficiently.
- How to use the runnable examples to test your own understanding.
Key terms
Econometrics: statistical methods adapted to economic data and economic questions.
Estimate: a number computed from a sample that is meant to approximate an unknown quantity in the population.
Causal effect: what would change in an outcome if we changed one input and nothing else.
Model: a simplified equation or system of equations that describes how the data might have been produced.
Who this course is for
You may be an economics or business student meeting regression for the first time, a data analyst who runs regressions but wants to know why they work, or a self-learner preparing for research or a master's program. The course follows the common core taught in university introductory and intermediate econometrics worldwide: the linear model, inference, the classical problems, instrumental variables, panel and time series data, and modern causal methods. We do not follow any single textbook, and every example, picture and exercise here is original.
Prerequisites. You need school-level algebra (solving equations, reading a straight-line graph) and a feel for averages. Basic probability and statistics help, but Chapter 2 reviews exactly what you will use. Calculus is not required for the main text: where a derivation uses a derivative, we explain the idea in words and show the result. You do not need to know Python before you start. Each code block is short, commented and self-contained, and you learn the few commands you need as you go.
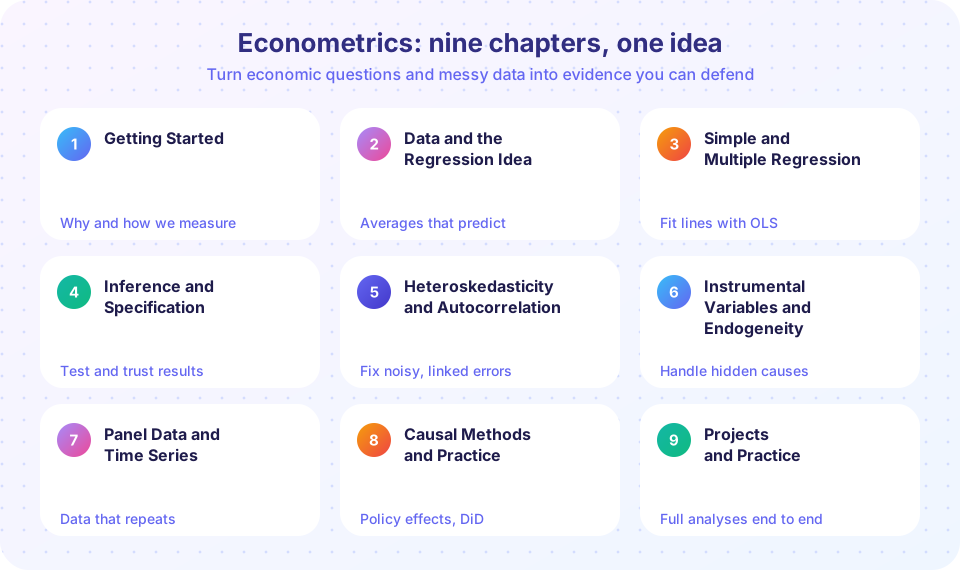
The nine chapters at a glance
Build the toolkit
- Getting started
- Data and regression idea
- Simple and multiple regression
Trust, test and repair
- Inference
- Broken assumptions
- Instruments
Apply it for real
- Panel and time series
- Causal methods
- Projects
The chapters fall into three arcs. Chapters 1 to 3 build the toolkit: what the job is, what a random variable and a conditional average are, and how ordinary least squares draws the best line through a cloud of points. Chapters 4 to 6 teach you to trust results: how to test hypotheses, what happens when the classical assumptions fail, and how instrumental variables rescue you when a hidden cause contaminates your estimate. Chapters 7 to 9 apply everything to real research designs: panel data, time series, difference-in-differences, regression discontinuity and full projects.
How each lesson is built
Every lesson uses the same shape, so you always know where you are.
- A short introduction that says what the tool is and why anyone cares.
- What you will learn: the outcomes you should be able to demonstrate afterwards.
- Key terms: the vocabulary, in plain words.
- The explanation, with worked examples that use numbers, an illustration near the top, and the reasoning an expert would follow.
- Common misconceptions: the wrong beliefs that cost beginners the most.
- Try it: two or three runnable examples. Change the numbers. Break them on purpose. That is how the ideas stick.
- A short quiz, a summary and a link to the next lesson.
Chapter overviews give the big picture and list every lesson of the chapter. Chapter reviews finish with a picture of the chapter and a longer quiz that mixes all its lessons.
How to study
Read with a pencil. Whenever the text gives a formula, compute one example by hand before running the code. A slope calculated once by hand is understood forever; a slope read from a screen is forgotten by lunchtime.
Predict, then run. Before you press Run, say what you expect the output to be. When you are wrong, that is exactly the moment learning happens.
Break the examples. Change the sample size, the noise level or the true coefficient and watch what moves. Econometrics is largely the study of what changes and what does not when you alter something in the data-generating process.
Separate three questions. For every estimate ask: What does the number mean? (interpretation), How precise is it? (inference), and Is it the effect I care about? (identification). Most mistakes in applied work are mistakes about the third question.
Space it out. A lesson a day beats four lessons on Sunday. A realistic pace for the whole course is eight to twelve weeks at three to five lessons a week.
About the data
Almost all datasets in this course are simulated or invented, and every example says so. This is deliberate. When we generate the data ourselves, we know the true answer, so we can check whether a method recovers it. That is how you learn what a method can and cannot do. Where a lesson mentions a famous real study, we describe what it found in general terms and never invent numbers.
Common misconceptions
"Econometrics is just running regressions in software." The software takes seconds. The hard part is deciding which question you are answering, whether the data can answer it, and what the number means. Two analysts with the same data and the same software can produce opposite conclusions because they made different assumptions.
"A significant result means an important result." Statistical significance says an estimate is unlikely to be pure noise. It says nothing about whether the effect is large enough to matter. You will learn to report both size and precision.
"I need advanced math first." You need careful thinking more than advanced math. The mathematics grows gradually, and each new idea is introduced with a picture before the formula.
Try it
The first example is a miniature of the whole course: invent some data in which wages rise with schooling, then let Python recover the relationship. It is a demonstration with made-up numbers, not a real study.
Press Run (or Ctrl + Enter) to see the result here.
Program input · what you'd type while the program runs
Type the answers before you press Run, one per line. Each time the program reads a line (with input()), it gets the next line from this box.
The true slope we built into the data is 1.1. Your estimate will land near it but not on it, because the noise term hides the exact rule. How near it lands, and how you could know that without seeing the true value, is the subject of Chapter 4. Try changing the noise from 4 to 10 and see how the estimate wanders.
The second example draws the picture that every chapter keeps returning to.
Press Run (or Ctrl + Enter) to see the result here.
Program input · what you'd type while the program runs
Type the answers before you press Run, one per line. Each time the program reads a line (with input()), it gets the next line from this box.
Check your understanding
Quick check · 4 questions
of 4 answered You scored / 4 · perfect!
-
1. Which question is most clearly about identification rather than precision?
Identification asks whether the estimate captures the effect you care about. Interval width and sample size are about precision. -
2. Why does this course mostly use simulated data?
With simulated data the true parameters are known, so you can see exactly what a method gets right or wrong. -
3. Which chapter group teaches you to test hypotheses and repair broken assumptions?
Chapters 4 to 6 cover inference, violations of the classical assumptions and instrumental variables. -
4. What is the best habit when a lesson shows code?
Predicting before running exposes gaps in understanding, and changing inputs shows what drives the result.
Summary
- Econometrics answers "how much, and how sure?" questions from data.
- The course has nine chapters in three arcs: toolkit, trust and repair, application.
- Each lesson has outcomes, key terms, examples, misconceptions, runnable code, a quiz and a summary.
- Always separate interpretation, precision and identification.
- Data in the course are simulated or invented, so you can compare estimates with the known truth.
Next: What is econometrics?
Track your progress
Create a free account to tick off lessons and pick up where you left off on any device.
of Econometrics lessons completed