


















Lesson 20 of 49 · Inference and Specification
F tests and joint hypotheses
Learn how to test several restrictions at once with the F statistic, compute it from sums of squares or R-squared, test overall significance and equality of coefficients, with worked examples.
A t test answers questions about one coefficient at a time. But many real questions involve several coefficients together. Do any of the regional dummies matter? Do experience and experience-squared jointly affect wages? Do all the explanatory variables in the model, taken together, explain anything at all? Testing each coefficient separately does not answer these questions, and the individual tests can even point the wrong way. The tool for joint questions is the F test.
The idea is simple and elegant: estimate the model twice, once freely and once with the hypothesized restrictions forced to hold, and ask whether forcing them makes the fit significantly worse.
What you will learn
- What a joint hypothesis is and why separate t tests do not replace an F test.
- How to compute the F statistic from sums of squares and from R-squared.
- How to test overall significance and equality of two coefficients.
- How the F test relates to the t test.
Key terms
Joint hypothesis: a null that restricts several coefficients simultaneously, such as β2 = β3 = 0.
Restricted model: the model estimated with the null imposed.
Unrestricted model: the model estimated freely.
Number of restrictions q: how many equations the null contains.
F distribution: the distribution of the F statistic under the null, with q and n − k − 1 degrees of freedom.
Why not just use several t tests?
Suppose you want to know whether two regressors x2 and x3 both have zero coefficients. Running two t tests has two problems. First, the significance level compounds: two 5% tests together reject a true null more often than 5% of the time. Second, regressors can be highly correlated, so each coefficient is imprecisely estimated and neither is individually significant, even though together they matter a great deal. The F test evaluates the pair jointly and accounts for their covariance.
The F statistic
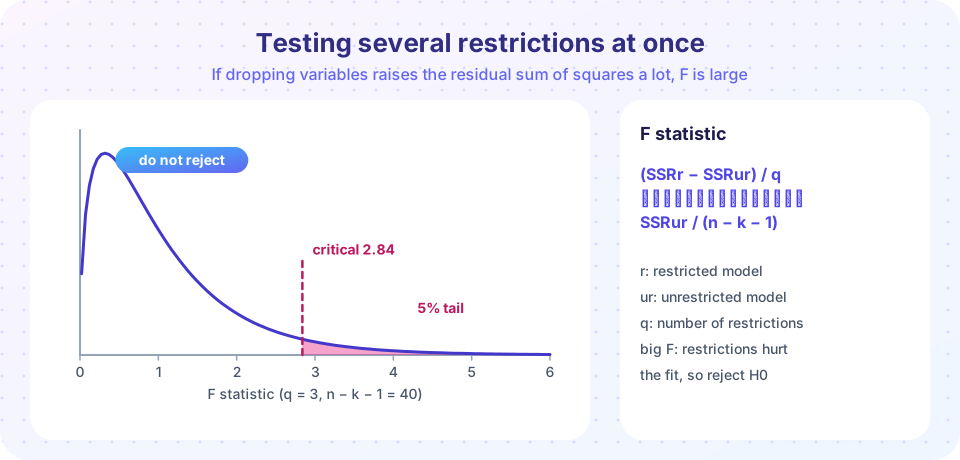
Let SSRr be the sum of squared residuals from the restricted model (the null imposed) and SSRur the one from the unrestricted model. Imposing restrictions can only raise the SSR, because the unrestricted fit has more freedom. If the restrictions are true, the rise should be small, just noise. If they are false, it will be large. The F statistic measures the relative rise:
F = [ (SSRr − SSRur) / q ] / [ SSRur / (n − k − 1) ]
where q is the number of restrictions and n − k − 1 is the degrees of freedom of the unrestricted model. Under the null (and MLR.1 to MLR.6) the statistic follows an F distribution with (q, n − k − 1) degrees of freedom. Reject when F exceeds the critical value, or equivalently when the p-value is below α. Because a large rise in SSR always means evidence against H0, the F test is a one-tailed test in the right tail, as in the picture.
The R-squared form
If both models have the same dependent variable, you can use R-squared instead:
F = [ (R²ur − R²r) / q ] / [ (1 − R²ur) / (n − k − 1) ]
This version is convenient when a paper reports R-squared but not SSR. It is valid only when the dependent variable is identical in the two models (for example, it fails if one regression uses wage and the other ln wage).
Worked example
A wage regression has k = 4 regressors and n = 52 observations. We test whether two of them (say, two regional dummies) have zero coefficients: H0: β3 = β4 = 0, so q = 2. The unrestricted model has SSRur = 250; the restricted model without those two variables has SSRr = 300. The unrestricted degrees of freedom are 52 − 4 − 1 = 47.
F = [(300 − 250) / 2] / [250 / 47] = 25 / 5.319 = 4.70
The 5% critical value of F(2, 47) is about 3.20. Since 4.70 > 3.20, we reject the null: the two variables are jointly significant. The fit deteriorates by too much when they are dropped for the change to be noise.
Overall significance
The F statistic reported at the bottom of every regression output tests H0: β1 = β2 = ... = βk = 0, that all slope coefficients are zero: the model explains nothing beyond the intercept. The restricted model is "predict ȳ", with R²r = 0, so the R-squared form becomes
F = [ R² / k ] / [ (1 − R²) / (n − k − 1) ]
For R² = 0.40, k = 3 and n = 50: F = (0.40/3) / (0.60/46) = 0.1333 / 0.01304 ≈ 10.2. The 5% critical value of F(3, 46) is about 2.81, so the regression is jointly significant by a wide margin. Overall significance is a weak hurdle: most regressions published in journals pass it. It says little about whether the model is good.
Testing equal coefficients
A common joint-style question is whether two coefficients are equal: H0: β1 = β2 (do education at community college and at university pay equally?). This is a single restriction (q = 1). A neat trick is to rewrite the model so the restriction becomes "one coefficient equals zero". Let θ = β1 − β2. Then β1 = θ + β2 and
y = β0 + β1·x1 + β2·x2 + u = β0 + θ·x1 + β2·(x1 + x2) + u
Regress y on x1 and on the sum x1 + x2. The coefficient on x1 is θ, and its ordinary t test tests H0: β1 = β2. No special software is needed.
Relation between the t and F tests
When there is a single restriction (q = 1), the F statistic equals the square of the t statistic: F = t², and the two tests give identical conclusions and p-values. The F test generalizes the t test to several restrictions and to two-sided hypotheses spanning several coefficients; it cannot be used for one-sided alternatives.
When does an F test matter in practice?
- Groups of related variables: a set of industry dummies, region dummies or year dummies should be tested as a block.
- Polynomial terms: test
xandx²jointly to see whether the variable matters at all. - Interactions: test a dummy and its interactions jointly to ask whether two groups differ in any way (a Chow test).
- Model comparison: when one model nests another, an F test tells you whether the extra variables are worth including.
Common misconceptions
"If no coefficient is individually significant, the model is useless." Highly correlated regressors can all have large standard errors while jointly being strongly significant. Check the F test.
"A significant overall F means every variable matters." It means at least one slope is nonzero.
"The R-squared form of F works for any pair of models." Only if the dependent variable is the same in both.
"F tests are for one-sided questions." They test equality hypotheses (two-sided in spirit); for one-sided hypotheses on a single coefficient, use a one-sided t test.
Try it
First example: compute the F statistic by hand for the worked numbers and confirm the critical value and p-value with scipy. We also check the overall-significance example.
Press Run (or Ctrl + Enter) to see the result here.
Program input · what you'd type while the program runs
Type the answers before you press Run, one per line. Each time the program reads a line (with input()), it gets the next line from this box.
Second example: a full simulation. Only x1 matters. We test H0: β2 = β3 = 0 (true) and H0: β1 = β2 = 0 (false) by estimating restricted and unrestricted models, and check that, for one restriction, F = t².
Press Run (or Ctrl + Enter) to see the result here.
Program input · what you'd type while the program runs
Type the answers before you press Run, one per line. Each time the program reads a line (with input()), it gets the next line from this box.
Third example: the F distribution is the null distribution. We simulate 5,000 studies in which the null is true, compute the F statistic each time and compare the histogram with the theoretical curve.
Press Run (or Ctrl + Enter) to see the result here.
Program input · what you'd type while the program runs
Type the answers before you press Run, one per line. Each time the program reads a line (with input()), it gets the next line from this box.
Check your understanding
Quick check · 5 questions
of 5 answered You scored / 5 · perfect!
-
1. An F test is the right tool when you want to test
The F test evaluates joint hypotheses involving two or more restrictions. -
2. Imposing restrictions on a regression makes the sum of squared residuals
The restricted fit has less freedom, so SSR cannot fall. -
3. With SSRr = 300, SSRur = 250, q = 2 and 47 residual degrees of freedom, F is about
F = (50/2)/(250/47) = 25/5.32 ≈ 4.70. -
4. For a single restriction (q = 1), the F statistic equals
With one restriction F = t², and the two tests agree. -
5. Which situation shows why F tests matter?
Correlated regressors inflate individual standard errors while the pair still explains the outcome.
Summary
- A joint hypothesis restricts several coefficients at once; the F test compares the restricted and unrestricted fit.
F = [(SSRr − SSRur)/q] / [SSRur/(n − k − 1)], with an F distribution with(q, n − k − 1)degrees of freedom under the null.- The R-squared form requires the same dependent variable in both models.
- The reported overall F tests that all slopes are zero; it is a weak hurdle.
- For one restriction
F = t²; to testβ1 = β2, reparametrize so the restriction becomes a zero coefficient.
Next: Specification, omitted variables and multicollinearity
Track your progress
Create a free account to tick off lessons and pick up where you left off on any device.
of Econometrics lessons completed