


















Lesson 3 of 49 · Getting Started
Data types and variables
Learn the four data structures of econometrics (cross-section, time series, pooled cross sections, panel) and the main kinds of variables, with examples and runnable code.
Before you choose a method you must know what kind of data you hold. The same question, "does education raise wages?", can be studied with a survey of 5,000 workers in one year, with the national average wage across 50 years, or with the same 2,000 people followed for a decade. Each data set carries different information, and each needs different tools. Choosing a method without understanding the data structure is like choosing a knife without knowing whether you are cutting bread or carving wood.
This lesson names the four standard data structures, introduces the kinds of variables you will meet, and shows how to represent each structure in a table.
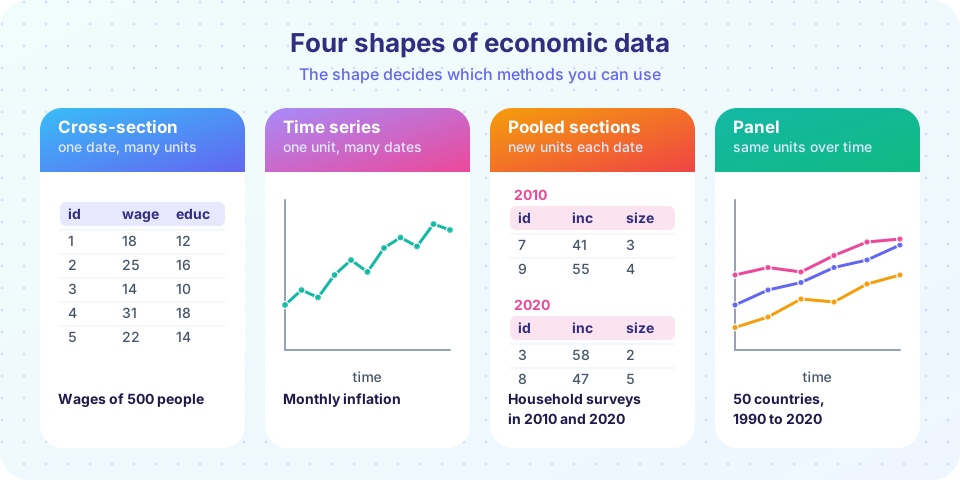
What you will learn
- The four data structures: cross-section, time series, pooled cross sections and panel.
- How to recognize each from a data table.
- The difference between continuous, discrete, binary and categorical variables.
- Why the type of variable and its scale affect interpretation.
Key terms
Observation: one row of data, such as one person, one firm, or one month.
Variable: a characteristic that differs across observations, such as wage or age.
Cross-sectional data: many units observed at one point in time.
Time series: one unit observed at many points in time.
Panel (longitudinal) data: the same units observed repeatedly over time.
The four structures
Cross-sectional data
A cross section records many units (people, households, firms, countries) at a single point in time, or close enough that time does not matter. A survey that asks 500 workers in March for their wage, schooling, age and occupation is a cross section. Each row is a different person, and the order of rows carries no meaning: you can shuffle them without losing information.
Most introductory regression is done on cross sections, and the central assumption is random sampling: the units are drawn independently from a population. When that holds, a cross section is the cleanest setting to learn the method.
Time series data
A time series follows a single unit through time: monthly inflation in one country, daily closing prices of one share, annual GDP. Here the order matters enormously. Today's value usually depends on yesterday's, so observations are not independent, and the usual assumption of random sampling fails. Time series also show trends (a long rise), seasonality (regular yearly patterns) and sudden breaks. Chapter 7 is devoted to the tools these features demand.
The frequency of a series (daily, monthly, quarterly, annual) matters too. Unemployment published every month supports different questions from the same concept published once a year.
Pooled cross sections
Sometimes you have repeated surveys, but each survey interviews different people, such as a household survey in 2010 and another in 2020. Stacking them gives pooled cross sections. Pooling increases the sample size and lets you study change over time at the group level. It is the raw material of "before and after" comparisons: did average housing prices near a new rail line rise more than elsewhere? You cannot follow any single household, because it was probably not interviewed twice.
Panel (longitudinal) data
A panel follows the same units over time: 50 countries across 30 years, or 2,000 workers surveyed every year for a decade. Panels are the richest structure. They let you control for traits of each unit that do not change (a person's fixed temperament or a country's geography), even when you cannot measure them. We study fixed and random effects in Chapter 7.
In a panel, you write wage_it for the wage of person i in year t. A balanced panel has every unit observed in every period; an unbalanced panel has gaps, often because people drop out of the survey.
| Structure | Units | Periods | Typical question |
|---|---|---|---|
| Cross-section | many | one | Do wages rise with schooling across people? |
| Time series | one | many | How does inflation respond to interest rates over time? |
| Pooled cross sections | many, different each period | few | Did the rail line raise prices? |
| Panel | many, the same | many | What happens to a worker's wage when she gets a promotion? |
Kinds of variables
Beyond the data structure, each column of the data has a type.
Continuous (quantitative) variables can take many values on a scale where differences are meaningful: wage in dollars, height in centimeters, GDP. Means, slopes and averages make sense.
Discrete (count) variables take whole-number values: the number of children, of patents, of doctor visits. They are often skewed with many zeros, and later courses give them special models.
Binary variables have two values, usually coded 0 and 1: employed or not, female or not, treated or not. A binary variable coded as 0/1 is called a dummy variable or indicator, and it is extremely useful: the mean of a dummy is the proportion of ones, and its coefficient in a regression is a group difference.
Categorical variables have several unordered categories: industry, region, country. You cannot put a code such as 1, 2, 3 for three regions straight into a regression, because the numbers would imply an order and spacing that do not exist. Instead you create one dummy per category (leaving one out as the reference), a trick covered in Chapter 3.
Ordinal variables have ordered categories without equal spacing, such as survey ratings from "strongly disagree" to "strongly agree".
Levels, changes and logs
The same economic quantity can be measured in several ways, and the choice affects interpretation. You might use wage in levels (dollars), its change from last year, its percentage change or its natural logarithm. A 10 percent raise means very different dollar amounts for a janitor and a surgeon, so economists often work in logs, where the same difference means the same percentage change. We return to this in Chapter 3.
Be careful too with units and deflating. Money amounts measured in different years are not comparable until adjusted for inflation: a wage of 20 dollars in 1990 buys far more than 20 dollars today. A series like GDP in current prices mixes real growth with price changes; in real terms (constant prices) it isolates growth.
Worked example: choosing the structure
A researcher asks, "Do workers who receive training earn more later?" Consider three data sets:
- A survey in 2023 of 3,000 workers, recording training and current wage. This is a cross section. You can compare trained and untrained workers, but you cannot tell whether the trained were already earning more before training.
- Average wage and the national training rate for each year from 1980 to 2023. This is a time series of 44 observations. It cannot separate training from everything else that changed nationally in those years.
- The same 3,000 workers surveyed in each of 2018 to 2023. This is a panel. You can compare each worker's wages before and after training, which removes stable traits such as underlying ability.
The panel is the strongest design for this question, though not perfect (training might coincide with other changes). Noticing this before you estimate saves months of misguided effort.
Common misconceptions
"More observations always means better." Observations that are copies of the same unit (the same household recorded each month) are not independent pieces of information. A thousand rows may carry far less information than a thousand different people.
"A variable coded 1, 2, 3 is numeric, so I can average it." Averaging category codes (region 1, 2, 3) is meaningless. Averaging a 0/1 dummy is meaningful: it gives a proportion.
"Panel data fix everything." Panels remove traits that do not change over time, not traits that do. Something that changes at the same time as the treatment can still bias the estimate.
Try it
The first example builds one tiny version of each data structure with pandas so you can see how they differ as tables. The numbers are invented.
Press Run (or Ctrl + Enter) to see the result here.
Program input · what you'd type while the program runs
Type the answers before you press Run, one per line. Each time the program reads a line (with input()), it gets the next line from this box.
Notice that a panel has a two-part key, person and year, while a cross section has one key and a time series has one key too. The long format (one row per person-year) is the standard shape for panel regression.
The second example shows why variable types matter: averaging a dummy gives a proportion, and averaging category codes gives nonsense.
Press Run (or Ctrl + Enter) to see the result here.
Program input · what you'd type while the program runs
Type the answers before you press Run, one per line. Each time the program reads a line (with input()), it gets the next line from this box.
Check your understanding
Quick check · 5 questions
of 5 answered You scored / 5 · perfect!
-
1. A survey interviews 800 different households in 2015 and another 900 different households in 2020. This is
The units differ between the two dates, so the data are repeated cross sections, not a panel. -
2. Which structure lets you control for unmeasured traits of a person that never change?
Observing the same person repeatedly lets you compare her with herself over time, removing fixed traits. -
3. What does the mean of a 0/1 dummy variable measure?
Adding 1s and dividing by n counts the share of ones. -
4. Why not enter region coded 1, 2, 3 directly in a regression?
Use one dummy per category (minus a reference) instead of arbitrary numeric codes. -
5. Why are the rows of a time series NOT interchangeable?
Time order carries information, and neighboring observations are typically correlated.
Summary
- The four structures are cross-section, time series, pooled cross sections and panel.
- Cross sections assume independent draws; time series and panels have dependence that must be modeled.
- Panels let you remove unmeasured traits that do not change over time.
- Variables can be continuous, discrete, binary, categorical or ordinal, and the type fixes what an average or coefficient means.
- Check units and price adjustments before comparing money across years.
Track your progress
Create a free account to tick off lessons and pick up where you left off on any device.
of Econometrics lessons completed