


















Lesson 17 of 49 · Inference and Specification
Chapter 4 overview: inference and specification
Preview chapter 4: when OLS is unbiased and efficient, how t and F tests and confidence intervals work, and how omitted variables and multicollinearity affect estimates, with a simulation.
You have estimated a slope: schooling goes with $0.62 more per hour. Three questions immediately arise. Could that be just noise? If the true effect were zero, how often would a sample of this size produce an estimate this large? How precise is it? Is the plausible range $0.60 to $0.64, or $0.00 to $1.24? And is it the right number? Does the estimate capture what you care about, or is it contaminated by something left out?
Chapter 4 answers these questions. It begins with the assumptions under which OLS gives sensible answers, then builds the standard tools of statistical inference, the t test, the confidence interval and the F test, and ends with the specification problems (omitted variables, multicollinearity) that threaten the numbers.
What you will learn
- What each lesson in this chapter covers.
- The logic of a hypothesis test in plain language.
- Why inference and specification belong together.
Key terms
Null hypothesis (H0): the claim you test, often that a coefficient equals zero.
Test statistic: a number computed from the sample whose distribution under H0 is known.
p-value: the probability, if H0 were true, of getting a result at least as extreme as the one observed.
Confidence interval: a range of plausible parameter values built to cover the truth in a stated share of repeated samples.
Specification: the choice of which variables and which functional form to include.
The chapter at a glance
Why trust OLS?
Testing
Getting the model right
What each lesson covers
- Gauss-Markov and the classical assumptions lists the assumptions, proves unbiasedness, derives the standard error of a slope and explains what "best linear unbiased" means.
- t tests and confidence intervals shows how to test a single hypothesis, compute p-values and intervals, and interpret them without the common mistakes.
- F tests and joint hypotheses extends testing to several restrictions at once and to the overall significance of a regression.
- Specification, omitted variables and multicollinearity examines what happens when the model leaves out something important or includes variables that are nearly redundant.
- Chapter 4 review pulls everything together with ten mixed questions.
The logic of a test in one paragraph
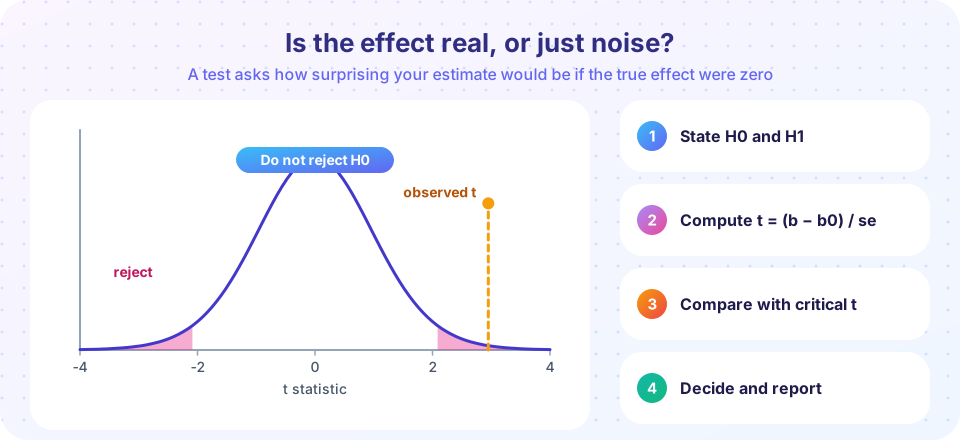
A hypothesis test works like a courtroom: the null hypothesis is the defendant "innocent until proven guilty". You compute an estimate, then ask how surprising it would be if the null were true. The estimate by itself cannot say that: a slope of 0.62 is large or small only relative to how much slopes vary from sample to sample, the standard error. So you divide the estimate by its standard error to get a t statistic. If the t statistic is extreme under the null, you reject; if it is ordinary, you do not. "Do not reject" is not "proved the null": it means the data are consistent with it, much as "not guilty" is not "innocent".
Try it
First, an experiment that makes the logic concrete. We create a world where the true slope is exactly zero (x has no effect on y), repeat the study 5,000 times and record the t statistic each time. If tests work, about 5% of studies should falsely reject at the 5% level.
Press Run (or Ctrl + Enter) to see the result here.
Program input · what you'd type while the program runs
Type the answers before you press Run, one per line. Each time the program reads a line (with input()), it gets the next line from this box.
Second, a picture of the same experiment: the histogram of estimated slopes when the truth is zero, with the observed estimate of a hypothetical study marked on it.
Press Run (or Ctrl + Enter) to see the result here.
Program input · what you'd type while the program runs
Type the answers before you press Run, one per line. Each time the program reads a line (with input()), it gets the next line from this box.
Common misconceptions
"Failing to reject means the effect is zero." It means the data do not provide enough evidence against zero. A small sample may simply be too imprecise to tell.
"Inference fixes bias." Tests and intervals describe sampling noise. If an estimate is biased, a tiny standard error just makes you confidently wrong.
Check your understanding
Quick check · 4 questions
of 4 answered You scored / 4 · perfect!
-
1. A t statistic is the estimate divided by
Dividing by the standard error measures the estimate in units of its typical sampling variation. -
2. In 5,000 studies where the true slope is zero, about what share should reject at the 5% level?
By definition, a 5% test falsely rejects a true null about 5% of the time. -
3. Failing to reject H0: β = 0 means
Absence of evidence against the null is not evidence for it. -
4. Which lesson covers testing several coefficients at once?
The F test handles joint hypotheses.
Summary
- Chapter 4 covers the assumptions behind OLS, t tests, confidence intervals, F tests and specification problems.
- A test asks how surprising an estimate would be if the null hypothesis were true.
- The t statistic scales an estimate by its standard error.
- Inference quantifies noise; it cannot repair bias from a badly specified model.
Track your progress
Create a free account to tick off lessons and pick up where you left off on any device.
of Econometrics lessons completed