


















Lesson 40 of 48 · Frequency Response and Resonance
Transfer Functions and Bode Plots
Learn to compute H(jω), plot gain in decibels and phase against log frequency, and sketch Bode plots from straight-line asymptotes for RC and multi-stage circuits.
A circuit's response to every possible frequency is a lot of information. A Bode plot (pronounced "BOH-dee", after Hendrik Bode of Bell Labs) squeezes it into two graphs: gain in decibels and phase in degrees, both against frequency on a logarithmic axis. The great trick is that on these axes the curves of simple circuits are well approximated by straight lines, so you can sketch a response in seconds, check a design by eye and see at a glance where a circuit changes character.
What you will learn
- How to derive
H(jω)for an RC circuit and convert to gain and phase. - What the corner (cutoff) frequency is and why the −3 dB point matters.
- How to draw straight-line asymptotes: flat, then ±20 dB per decade.
- How to combine several stages by adding dB curves.
Key terms
Decade: a factor of 10 in frequency. Octave: a factor of 2.
Corner frequency ω_c: where the asymptotes meet; for first-order circuits it equals the cutoff.
Roll-off: the slope of the gain beyond the corner, −20 dB/decade per pole (about −6 dB/octave).
Pole / zero: a frequency where the transfer function's denominator / numerator changes character.
The RC low-pass in detail
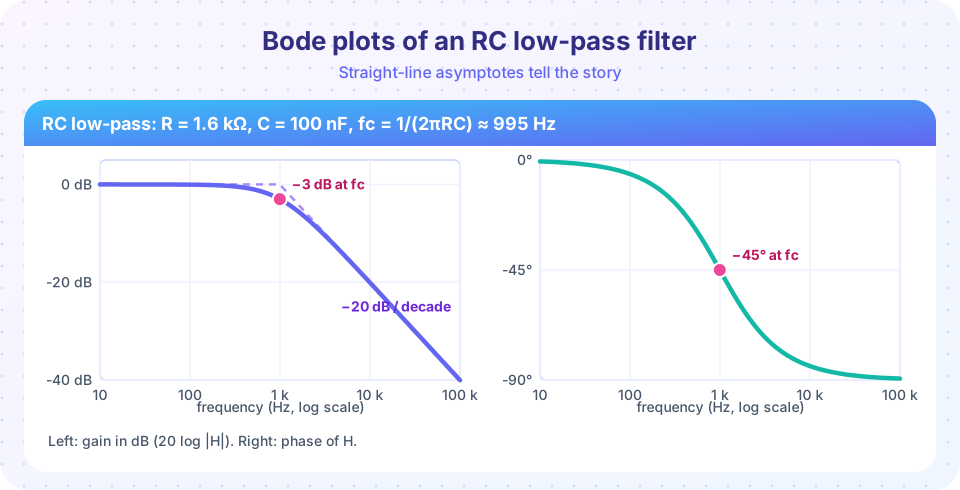
Take R = 1.6 kΩ and C = 100 nF. The transfer function from the previous lesson, H(jω) = 1/(1 + jωRC), can be written with the corner frequency ω_c = 1/(RC) (f_c = 1/(2πRC) = 994.7 Hz):
H(jω) = 1 / (1 + j ω/ω_c)
Its magnitude and phase:
|H| = 1 / √(1 + (ω/ω_c)²) and ∠H = −arctan(ω/ω_c)
Evaluate at four important frequencies:
| Frequency | ω/ω_c |
Magnitude | Gain (dB) | Phase |
|---|---|---|---|---|
0.1 f_c |
0.1 | 0.995 | −0.04 | −5.7° |
f_c |
1 | 0.707 | −3.01 | −45° |
10 f_c |
10 | 0.0995 | −20.04 | −84.3° |
100 f_c |
100 | 0.01 | −40.0 | −89.4° |
Asymptotes
Far below the corner, ω/ω_c ≪ 1 and the gain is 0 dB. Far above, |H| ≈ ω_c/ω, so the gain in dB is −20 log₁₀(ω/ω_c): a straight line falling by 20 dB for every factor of 10 in frequency. The two lines meet at ω_c. The true curve lies 3 dB below the meeting point, and that is the biggest error of the straight-line approximation.
The phase has its own asymptote rule of thumb: about 0° up to a tenth of the corner, −45° at the corner, and about −90° from ten times the corner up. A reasonable sketch connects 0° at 0.1 f_c to −90° at 10 f_c through −45° at f_c.
The high-pass twin
Swap the positions of R and C (output across R) and H(jω) = jωRC / (1 + jωRC). Now the gain rises at +20 dB/decade below the corner and is flat above it, and the phase starts at +90° and falls to 0°, passing +45° at the corner. At the same corner frequency, the low-pass and high-pass gains are both −3 dB, and their phases are 90° apart in the pass bands.
Building up from several stages
In decibels, multiplying transfer functions becomes adding curves. Suppose an amplifier has a mid-band gain of 100 (40 dB) with two poles, one at 1 kHz and one at 100 kHz:
H = 100 / [ (1 + jf/1 kHz)(1 + jf/100 kHz) ]
Sketch it:
- 40 dB flat up to 1 kHz.
- From 1 kHz to 100 kHz, slope −20 dB/decade. After two decades the gain has fallen by 40 dB, reaching 0 dB at 100 kHz.
- Above 100 kHz the second pole adds another −20 dB/decade: −40 dB/decade total.
The gain reaches unity (0 dB) near 100 kHz, which engineers call the unity-gain bandwidth. Each pole also adds up to −90° of phase.
Reading a Bode plot
- Pass band: flat region where the gain is near its maximum.
- Bandwidth: the frequency range where the gain stays within 3 dB of the maximum.
- Roll-off rate: how steep the fall is; steeper means a sharper filter and a higher order.
- Phase: how much the output lags; important in feedback systems, where large lag leads to instability.
Common misconceptions
"The asymptotes are the exact response." They are an approximation that is off by 3 dB at the corner of a first-order pole.
"−3 dB means half the amplitude." It means half the power; the amplitude is 0.707.
"Phase on a Bode plot is the time delay." It is an angle; the time delay is Δt = −φ/ω, which depends on frequency.
Try it
The first program calculates the table above (and the 10 kHz case) so you can try other R and C values.
Press Run (or Ctrl + Enter) to see the result here.
Program input · what you'd type while the program runs
Type the answers before you press Run, one per line. Each time the program reads a line (with input()), it gets the next line from this box.
The second program draws the Bode magnitude plot of the two-pole amplifier, with the asymptotes dashed over the true curve.
Press Run (or Ctrl + Enter) to see the result here.
Program input · what you'd type while the program runs
Type the answers before you press Run, one per line. Each time the program reads a line (with input()), it gets the next line from this box.
Check your understanding
Quick check · 6 questions
of 6 answered You scored / 6 · perfect!
-
1. An RC low-pass has R = 10 kΩ and C = 16 nF. Its cutoff frequency is about
fc = 1/(2π × 10 000 × 16×10⁻⁹) = 995 Hz ≈ 1 kHz. -
2. Beyond the cutoff a first-order low-pass falls at
One pole gives −20 dB/decade (about −6 dB/octave). -
3. The phase of a first-order low-pass at its cutoff frequency is
∠H = −arctan(1) = −45°. -
4. A stage with 6 dB gain is followed by a stage with 14 dB gain. The total is
Decibel gains add: 6 + 14 = 20 dB, which is a voltage gain of 10. -
5. What is the gain in dB of a first-order low-pass one decade above the cutoff?
At 10 fc, |H| ≈ 0.0995, which is about −20 dB. -
6. The true response at the corner is how far below the asymptote intersection?
At ω = ω_c the true gain is −3.01 dB while both asymptotes sit at 0 dB.
Summary
H(jω) = 1/(1 + jω/ω_c)for the RC low-pass;ω_c = 1/RC,f_c = 1/(2πRC).- Gain: 0 dB below the corner, −3 dB at it, −20 dB/decade above; phase 0° → −45° → −90°.
- High-pass is the mirror image with +20 dB/decade below the corner.
- In dB, cascaded stages add; each pole adds −20 dB/decade and up to −90° of phase.
Next: Filters
Track your progress
Create a free account to tick off lessons and pick up where you left off on any device.
of Circuit Analysis lessons completed