


















Lesson 41 of 46 · Evolution and Biogeography
Chapter 8 review: evolution and biogeography
Review natural selection, speciation, the tree of life, island biogeography and deep time with a summary picture, a parsimony exercise and ten quiz questions.
This chapter connected a mechanism (natural selection and other forces that change allele frequencies), a pattern (the tree of life and where animals live) and a history (fossils, mass extinctions and dating). Use the picture and table to refresh the main ideas. The parsimony exercise then shows how biologists turn trait data into a tree, and the quiz mixes every lesson.
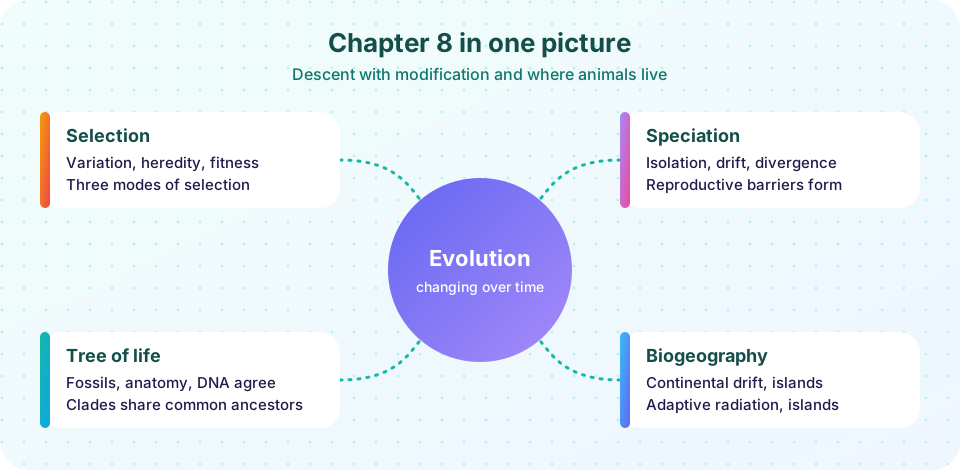
Recap table
| Topic | Key idea | Remember |
|---|---|---|
| Natural selection | Variation, heredity, unequal reproduction | Populations evolve, individuals do not |
| Modes | Directional, stabilizing, disruptive | Finch beaks, birth weight, seedcracker finches |
| Other forces | Drift, gene flow, mutation | Drift is strongest in small populations |
| Hardy-Weinberg | p² + 2pq + q² = 1 |
The null model |
| Species | Reproductively isolated groups | Pre- and postzygotic barriers |
| Speciation | Allopatric, sympatric, peripatric | Reduced gene flow starts it |
| Evidence | Fossils, anatomy, embryos, biogeography, DNA | Homology shows ancestry |
| Tree reading | Nodes are ancestors; clades include all descendants | Tips can rotate freely |
| Island theory | Equilibrium of immigration and extinction | S = c A^z |
| Radiation, convergence | Many forms from one ancestor; similar forms from different ones | Finches, cichlids; sharks and dolphins |
| Deep time | Cambrian explosion, five mass extinctions | End-Permian was the worst |
| Dating | t = half-life × log2(N0/N) |
Carbon-14 for up to about 50,000 years |
The chapter, lesson by lesson
Overview. Darwin and Wallace proposed descent with modification driven by natural selection. Fossils, comparative anatomy, embryology, biogeography and DNA all support it. A phylogenetic tree shows common ancestors at its nodes, and a clade is an ancestor plus all of its descendants. A molecular clock turns genetic differences into rough divergence times, T = d / (2μ).
Natural selection and speciation. Selection needs variation, heredity and unequal reproductive success, and it works as directional, stabilizing or disruptive selection. Drift, gene flow and mutation also change allele frequencies, and Hardy-Weinberg gives the baseline. Species stay separate through reproductive barriers, and speciation begins when gene flow is reduced, most often by a geographic barrier.
Biogeography and deep time. Wallace's line, Gondwana and the Panama land bridge show how geology shapes animal distributions. The island equilibrium theory and the species-area relationship S = c A^z predict species numbers, and also species loss when habitat shrinks. Adaptive radiation and convergence show selection at work, and radiometric dating supplies the time scale for the Cambrian explosion and the five mass extinctions.
Worked problems
- Hardy-Weinberg. In a population, 9 percent of animals show a recessive trait (aa). Then
q² = 0.09, soq = 0.3andp = 0.7. Carriers (Aa) are2pq = 0.42, or 42 percent. - Radiometric dating. A bone has 3 percent of its original carbon-14. Age is
5,730 × log2(1/0.03), about 29,000 years. This is within the roughly 50,000-year limit of the method. - Molecular clock. Two species differ at 3 percent of sites and the rate is
1.5 × 10⁻⁹per site per year per lineage. ThenT = 0.03 / (2 × 1.5 × 10⁻⁹) = 10 million years. - Species-area. An island 20 times larger than another, with
z = 0.3, is expected to hold20^0.3, about 2.5 times as many species. - Selection mode. Medium-sized seeds are rare and finches with either very small or very large beaks do best. That is disruptive selection.
Common exam traps
- Saying that individuals evolve. Populations evolve across generations.
- Confusing homology (shared ancestry) with analogy or convergence (similar function, independent origin).
- Reading a tree as a ladder, or taking the tip order as meaningful.
- Treating Hardy-Weinberg as a description of real populations rather than a null model.
Try it
Parsimony says that the best tree is the one that explains the trait data with the fewest evolutionary changes. The code compares three possible trees for four species using a hypothetical table of six yes/no traits and the Fitch counting method.
Press Run (or Ctrl + Enter) to see the console output here.
No output.
Press Run (or Ctrl + Enter) to see the result here.
Program input · what you'd type while the program runs
Type the answers before you press Run, one per line. Each time the program reads a line (with input()), it gets the next line from this box.
Check your understanding
Quick check · 10 questions
of 10 answered You scored / 10 · perfect!
-
1. Which is a necessary condition for natural selection?
Without heritable variation that affects reproduction, selection cannot change a population. -
2. A trait distribution splits into two peaks. This is...
Both extremes are favored over the middle. -
3. In Hardy-Weinberg terms, if p = 0.6, what is the frequency of aa?
q is 0.4, so q squared is 0.16. -
4. Which pair describes allopatric speciation?
Allopatric means in different places. -
5. Which statement about a clade is correct?
A clade is a complete branch, ancestor plus all descendants. -
6. Equilibrium island theory predicts that a large, near island will have...
More colonists arrive and extinction rates are lower. -
7. Sharks and dolphins have similar streamlined bodies. This is...
Unrelated lineages evolved similar form for similar swimming demands. -
8. A sample has one quarter of its original carbon-14. Its age is about...
One quarter is two half-lives, 2 x 5,730 = 11,460 years. -
9. Which mass extinction was the most severe in marine animal losses?
The end-Permian event removed an estimated 80 to 95 percent of marine species. -
10. Which of these is NOT a line of evidence for evolution?
Evolution is supported by fossils, anatomy, embryology, biogeography and molecular data, not by wishes.
Summary
- Selection, drift, gene flow and mutation change allele frequencies; reproductive barriers and reduced gene flow create species.
- The tree of life, fossils and biogeography are three independent lines of evidence for common descent.
- Island theory and the species-area relationship explain species numbers and link evolution to conservation.
- Deep time and radiometric dating give the time scale for animal history.
Track your progress
Create a free account to tick off lessons and pick up where you left off on any device.
of Zoology lessons completed