


















Lesson 40 of 46 · Evolution and Biogeography
Biogeography and deep time: islands, continents and fossils
Learn why animals live where they do: Wallace's line, continental drift, island biogeography, adaptive radiation, convergence, mass extinctions and dating.
Look at a map of animals rather than countries, and a pattern appears. Kangaroos and koalas live only in Australia and nearby islands. Lemurs exist only on Madagascar. Hummingbirds are found only in the Americas. Two islands with similar climates can hold very different animals, and the animals of an island often resemble those of the nearest mainland more than animals of similar climate far away. Biogeography studies these patterns and explains them with geology, climate and evolution.
This lesson covers where animals live and why, how islands fill with species, what repeated patterns such as adaptive radiation and convergence show, and how the fossil record and dating methods give a time scale for it all.
What you will learn
- How Wallace's line, continental drift and land bridges shaped animal distributions
- The equilibrium theory of island biogeography and the species-area relationship
- Adaptive radiation, convergent evolution and the island rule
- The geologic time scale, mass extinctions and how radiometric dating works
Key terms
Biogeography: the study of the distribution of species across space and time. Vicariance: splitting of a range by a new barrier, such as the rifting of a continent. Dispersal: movement of individuals to new areas. Adaptive radiation: rapid diversification of a lineage into many forms that exploit different niches. Convergent evolution: unrelated lineages evolving similar traits under similar pressures. Half-life: the time for half of a radioactive isotope to decay.
Wallace's line and the shape of the animal world
In the 1850s and 1860s Alfred Russel Wallace traveled through the Malay Archipelago and noticed an abrupt change in wildlife across a narrow strait. On the west side, between Bali and Borneo, lay Asian animals such as tigers, rhinoceroses and monkeys. Just 35 kilometers east, across the deep Lombok Strait, the animals included cockatoos and marsupials of an Australian type. The boundary, later named Wallace's Line, follows deep water that stayed a barrier even when sea level fell during ice ages. From such observations Wallace divided the world into biogeographic regions, such as the Neotropical, Ethiopian and Australian realms, which are still used with modifications.
Continents on the move
In 1912 Alfred Wegener proposed that continents drift. His idea was rejected for decades because he could not explain a force, but in the 1960s seafloor spreading and plate tectonics supplied the mechanism. Animal distributions then made new sense. About 180 million years ago the supercontinent Gondwana began to break into South America, Africa, India, Antarctica and Australia. Lineages that lived on Gondwana were carried apart on separate plates, a process called vicariance. This helps explain why related animals, such as certain freshwater fishes and some insects, are found on distant southern continents.
It is not the only explanation. Flightless birds called ratites (ostriches, emus, rheas, kiwis) were long thought to illustrate Gondwanan vicariance, but DNA shows that their flightlessness evolved several times from flying ancestors that dispersed. Both vicariance and dispersal matter, and the evidence has to be examined case by case.
Land bridges also matter. When the Isthmus of Panama rose about three million years ago, it linked North and South America. In the Great American Biotic Interchange, species moved both ways: armadillos, opossums and porcupines went north, and cats, dogs, deer and horses went south. Many native South American hoofed mammals went extinct as new competitors and predators arrived.
Islands as natural laboratories
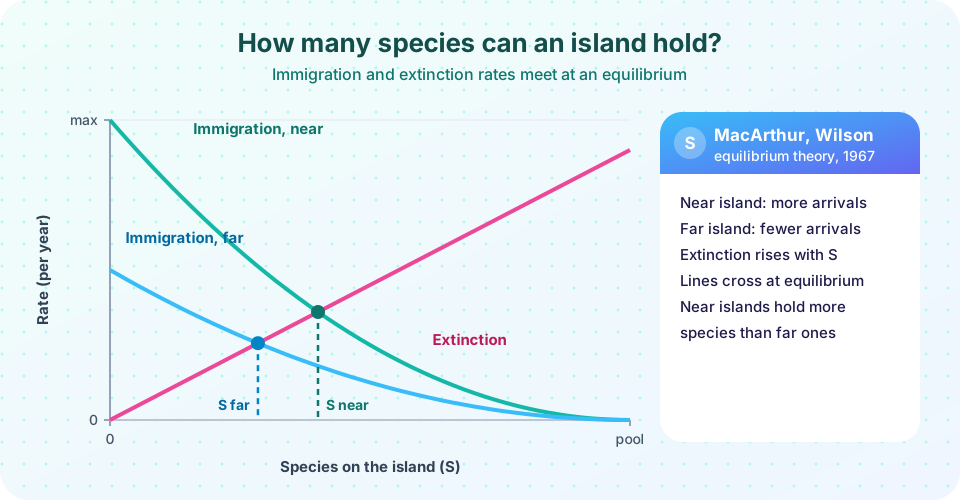
Islands are small and isolated, so they are easy to count and compare. In 1967 Robert MacArthur and E. O. Wilson proposed the equilibrium theory of island biogeography. The idea, shown in the figure, is that the number of species on an island reflects a balance:
- The immigration rate of new species falls as the island fills up, because fewer of the arriving species are new.
- The extinction rate rises as the island fills up, because populations are smaller and competition is stronger.
- The two curves cross at an equilibrium number of species,
S*. Species still come and go, but their number stays about constant.
Two predictions follow. A near island receives more colonists and so supports more species than a far island, and a large island, with bigger populations and lower extinction rates, supports more than a small one. The second is described by the species-area relationship:
S = c × A^z
where S is the number of species, A is area and c and z are constants; z is often between 0.15 and 0.35. A tenfold increase in area, with z = 0.25, raises species number by 10^0.25, about 1.8 times. After the 1883 eruption of Krakatau, which wiped out life on the island, researchers recorded the return of species and saw the numbers level off, in agreement with the theory. The same relationship shows what happens when habitat shrinks, a point to which conservation biologists return.
Adaptive radiation
When a lineage reaches empty habitat or acquires a key innovation, it can diversify rapidly into many forms. This is adaptive radiation. Classic cases include
- Darwin's finches of the Galápagos, descended from one ancestral species and now roughly fifteen species (the exact count depends on the classification) with beaks tuned for seeds, insects or cactus.
- Hawaiian honeycreepers, with beaks from thick seed-crackers to long curved nectar probes.
- Cichlid fishes in the African Great Lakes, where hundreds of species arose in Lake Victoria in a geologically short time.
- Anolis lizards on Caribbean islands, which evolved similar sets of forms (twig, trunk, grass) on each island independently.
After the extinction of non-avian dinosaurs about 66 million years ago, mammals radiated into the vacant niches of the following era.
Convergence and the island rule
Unrelated animals in similar environments often evolve similar features. Sharks (fish), ichthyosaurs (reptiles) and dolphins (mammals) all evolved streamlined bodies and fins. Marsupials in Australia evolved wolf-like, mole-like and mouse-like forms that parallel placental animals elsewhere; the Tasmanian thylacine looked like a dog but is a marsupial. Convergent evolution shows that selection, not ancestry alone, shapes form, and that similar problems have limited good solutions.
Island animals show size changes. Large mammals on islands tend to shrink (dwarf elephants and hippos on Mediterranean islands), and small mammals tend to grow (giant rodents). This pattern, the island rule, has many exceptions but fits many cases. Dwarf mammoths survived on Wrangel Island in the Arctic until about 4,000 years ago.
Deep time and the fossil record
Animals have a very long history. The geologic time scale divides it into eons, eras and periods based on rock layers and their fossils.
- About 4.5 billion years ago: Earth forms. Life appears by roughly 3.5 billion years ago or earlier.
- About 539 million years ago: the Cambrian period begins, with the "Cambrian explosion" in which most major animal body plans first appear in the fossil record.
- About 375 million years ago: Tiktaalik, a fish with a neck and limb-like fins, illustrates the water-to-land transition.
- About 66 million years ago: an asteroid impact and volcanic activity end the Cretaceous; non-avian dinosaurs disappear.
Life has also faced five mass extinctions: late Ordovician (about 445 million years ago), late Devonian (about 372), end-Permian (about 252, the most severe, with an estimated 80 to 95 percent of marine species lost), end-Triassic (about 201) and end-Cretaceous (about 66). Each was followed by recovery and diversification that took millions of years.
Dating the past
Rocks are dated by radioactive decay. An unstable isotope decays at a fixed rate described by its half-life. After one half-life half remains, after two a quarter, and so on:
N = N0 × (1/2)^(t / half-life)
t = half-life × log2(N0 / N)
Carbon-14, with a half-life of 5,730 years, can date organic remains up to about 50,000 years old. For older rocks, uranium-238 decays to lead-206 with a half-life of about 4.47 billion years, and uranium-lead and other methods date volcanic layers around fossils. The fossil's age is bracketed by the layers above and below it.
Common misconceptions
"Islands have fewer species because animals could not get there." Many can; the pattern also reflects extinction rates on small areas.
"Convergent evolution means the animals are closely related." Convergence is similar form in distant relatives. Close relatives share traits by inheritance, which is homology.
"Continental drift explains every distribution." Long-distance dispersal, land bridges and changes in climate also matter, and many groups need case-by-case study.
"Radiometric dating is unreliable because of changing decay rates." Decay rates are constant under conditions found in rocks, and different isotope systems give consistent ages.
Try it
The first calculation shows how habitat loss translates into species loss under the species-area relationship. The second is a radiometric dating calculator.
Press Run (or Ctrl + Enter) to see the result here.
Program input · what you'd type while the program runs
Type the answers before you press Run, one per line. Each time the program reads a line (with input()), it gets the next line from this box.
Press Run (or Ctrl + Enter) to see the console output here.
No output.
Check your understanding
Quick check · 6 questions
of 6 answered You scored / 6 · perfect!
-
1. Wallace's Line separates mainly...
The line runs between Bali and Lombok and between Borneo and Sulawesi, along deep water. -
2. According to island biogeography theory, which island holds the most species?
Near islands receive more colonists and large islands have lower extinction rates. -
3. With z = 0.25, if 90 percent of an area is lost (10 percent remains), about what fraction of species is eventually kept?
0.1 raised to 0.25 is about 0.56. -
4. Adaptive radiation is...
A lineage splits into many forms exploiting different resources. -
5. A sample has 12.5 percent of its original carbon-14. How many half-lives have passed?
12.5 percent is one eighth, which is three halvings. -
6. Which event ended the Cretaceous about 66 million years ago?
The end-Cretaceous extinction followed a large impact and massive volcanism.
Summary
- Animal distributions reflect geology, dispersal and evolution; Wallace's Line, Gondwana and the Panama land bridge are key examples.
- Island biogeography predicts species numbers from immigration and extinction; the species-area relationship
S = c A^zalso predicts losses from habitat destruction. - Adaptive radiation and convergent evolution show how selection shapes form; island animals often change in size.
- Deep time includes the Cambrian explosion and five mass extinctions; radiometric dating,
t = half-life × log2(N0/N), supplies the time scale.
Next: Chapter 8 review
Track your progress
Create a free account to tick off lessons and pick up where you left off on any device.
of Zoology lessons completed