


















Lesson 18 of 46 · Mechanical Properties
Stress-Strain Behavior: Elasticity, Yield and Strength
Read a stress-strain curve: Hooke's law, Young's modulus, Poisson's ratio, 0.2 percent offset yield, tensile strength, ductility, toughness and true stress.
The stress-strain curve is the identity card of a material. In one plot it holds the stiffness, the yield strength, the tensile strength, the ductility and the toughness. Engineers read it every day, and a materials scientist can tell a lot about a sample from its shape alone. This lesson walks along the curve from the origin to fracture, defines every number you can read off it, and then shows how to extract those numbers from raw test data in code.
What you will learn
- Hooke's law, Young's modulus, shear modulus and Poisson's ratio.
- How to find the yield strength using the 0.2 % offset method.
- The meaning of tensile strength, ductility, resilience and toughness.
- The difference between engineering and true stress and strain.
Key terms
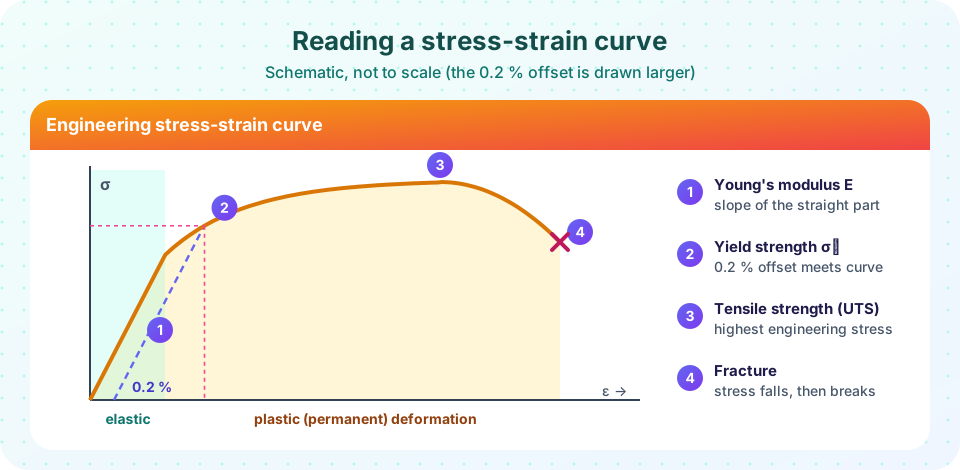
Young's modulus E: the slope of the elastic part, E = σ/ε.
Poisson's ratio ν: minus the ratio of lateral to axial strain, ν = −ε_lat/ε_axial.
Yield strength σ_y: the stress at which plastic deformation becomes significant (by convention the stress for a permanent strain of 0.2 %).
Tensile strength (UTS): the maximum engineering stress on the curve.
Elastic behavior: Hooke's law
For small strains most solids obey Hooke's law: stress is proportional to strain,
σ = E ε.
E, the Young's modulus, is a property of the material, set by the bond stiffness (chapter 2). It is about 205 GPa for steel, 70 GPa for aluminum, 117 GPa for copper, 3 GPa for nylon and 0.01 to 0.1 GPa for rubber. A rod of length L and area A stretches by δ = F L / (A E) under a force F, which is Hooke's law for a rod. Elastic strains in metals and ceramics are tiny: steel at its yield strength of 250 MPa strains by only 250/205 000 = 0.12 %.
Worked example. A steel specimen with a diameter of 12.8 mm has A₀ = π(6.4 mm)² = 128.7 mm² and a gauge length of 50 mm. With 25 kN applied, σ = 25 000/128.7 = 194 MPa. If the extensometer reads 0.0474 mm, then ε = 0.0474/50 = 9.48 × 10⁻⁴ and E = 194/9.48 × 10⁻⁴ ≈ 205 GPa, so the specimen is steel.
When you stretch a rod it also gets thinner. Poisson's ratio ν = −ε_lateral/ε_axial compares the two. For most metals ν ≈ 0.3, for ceramics 0.2 to 0.25 and for rubber close to 0.5 (rubber hardly changes volume). In shear, the stress-strain relation is τ = G γ with the shear modulus G = E/(2(1 + ν)), and under uniform pressure the bulk modulus K = E/(3(1 − 2ν)) gives the volume change. For steel with E = 205 GPa and ν = 0.29, G ≈ 79 GPa and K ≈ 163 GPa. For an isotropic material, E and ν determine all the elastic constants.
Yielding and plastic deformation
At some stress the curve leaves its straight line: the material has begun to deform plastically, and unloading would no longer return it to its original length. For many metals the departure is gradual, so the yield strength is defined by a convention, the 0.2 % offset method: draw a line parallel to the elastic slope, starting from a strain of 0.002 on the axis. Where it meets the curve is the yield strength. Some low-carbon steels show a sharp upper yield point followed by a drop and a plateau (Lüders band deformation), in which case the yield point is read directly.
Beyond yield, the stress needed to continue deformation usually increases: this is strain hardening (next lesson). The curve rises to a maximum, the tensile strength or UTS. This is the highest engineering stress the material can carry. Beyond that, the specimen forms a neck, a local thinning where all further deformation is concentrated. Since the load is now spread over a smaller area, the force needed falls and the engineering stress curve turns downward until the specimen fractures.
Ductility, resilience and toughness
Ductility is how much plastic deformation a material endures before fracture, quoted as percent elongation %EL = (L_f − L₀)/L₀ × 100 or percent reduction in area %RA = (A₀ − A_f)/A₀ × 100, measured on the broken pieces. Low-carbon steel has %EL of 25 to 40 %, while a ceramic has essentially 0. Brittle materials are those with less than about 5 % elongation.
Two energy measures come from the area under the curve (units of MPa = MJ/m³, energy per unit volume). Resilience, the energy that can be stored elastically up to yield, is σ_y²/(2E); it matters for springs. Toughness, the area under the whole curve, measures how much energy the material absorbs before breaking. A tough material combines strength and ductility, so a mild steel (modest strength, very large ductility) can be tougher than a high-strength steel with little ductility.
Press Run (or Ctrl + Enter) to see the result here.
Program input · what you'd type while the program runs
Type the answers before you press Run, one per line. Each time the program reads a line (with input()), it gets the next line from this box.
Engineering stress and true stress
The curve you get by dividing by the original area and length is the engineering curve. Once plastic deformation is significant the specimen's area shrinks, so the true stress (force over the instantaneous area) is higher. Under the assumption of constant volume during plastic flow, which holds up to necking, the true quantities follow from the engineering ones:
σ_T = σ (1 + ε) and ε_T = ln(1 + ε).
For σ = 400 MPa at ε = 0.15, σ_T = 460 MPa and ε_T = 0.140. The true stress-strain curve rises continuously until fracture, even though the engineering curve turns down after the UTS. The downturn is a geometric effect: it is caused by necking, not by the material getting weaker. Necking begins at the maximum load, where the strain hardening rate equals the stress (the Considère criterion, next lesson). Beyond it, stress in the neck is no longer uniform, so true-stress formulas apply only before necking.
Press Run (or Ctrl + Enter) to see the console output here.
No output.
Compression, shear and other tests
Metals behave nearly the same in compression as in tension up to yield. Ceramics are much stronger in compression than in tension (typically five to ten times), because compression closes cracks while tension opens them, so ceramic tests use compression or bending (flexural strength). Polymers are tested in tension but are sensitive to temperature and loading rate. Torsion tests give the shear modulus and shear strength, and indentation tests (hardness) are quick estimates of strength.
Common misconceptions
"The stress falls after the UTS because the metal weakens." The engineering stress falls because of the shrinking neck area; the true stress in the neck keeps rising.
"Yield strength is the stress at which a material breaks." Yield is where permanent deformation starts. The break stress is higher in ductile metals (the tensile strength) and happens later.
"A material with a higher E is stronger." E and yield strength are independent: many steels share E = 205 GPa but their yield strengths range from 200 MPa to over 1500 MPa.
Check your understanding
Quick check · 5 questions
of 5 answered You scored / 5 · perfect!
-
1. A steel rod's stress is 200 MPa and its strain is 0.001. Young's modulus is
E = σ/ε = 200 MPa / 0.001 = 200 000 MPa = 200 GPa. -
2. How is the 0.2 % offset yield strength found?
The offset line from strain 0.002 intersects the curve at the conventional yield point. -
3. Poisson's ratio of about 0.5 corresponds to a material that
ν = 0.5 means no volume change in elastic deformation. -
4. At fixed volume, true stress compared with engineering stress at 10 % strain is
σ_T = σ (1 + ε) = 1.1 σ. -
5. Toughness of a material corresponds to
Area under the curve is energy absorbed per unit volume up to fracture.
Summary
- In the elastic region
σ = Eε; E is set by bond stiffness;G = E/(2(1+ν))andK = E/(3(1−2ν)). - Yield strength is found with the 0.2 % offset line; the UTS is the maximum engineering stress; necking follows.
- Ductility is measured as %EL or %RA; resilience is
σ_y²/(2E); toughness is the area under the curve. - True stress and strain:
σ_T = σ(1+ε),ε_T = ln(1+ε), valid before necking. - E is independent of strength; ceramics are far stronger in compression than in tension.
Track your progress
Create a free account to tick off lessons and pick up where you left off on any device.
of Materials Science lessons completed