


















Lesson 22 of 46 · Phase Diagrams
Chapter overview: phase diagrams
A big-picture tour of phase diagrams: what a phase is, why composition and temperature decide structure, and how to read the maps used in metallurgy and ceramics.
Every engineer who has to choose a metal, design a solder joint or heat-treat a gear eventually asks the same question: what is inside this material at this temperature? A phase diagram answers it. It is a map with composition along one axis and temperature along the other, and each region of the map is labeled with the phases that are stable there once the material has had time to settle into equilibrium.
This chapter teaches you to read those maps and to calculate from them. By the end you will know how much liquid and solid coexist in a half-melted alloy, why solder melts at one sharp temperature, and why a few tenths of a percent of carbon change iron into steel. Chapters 6 to 8 lean on these ideas constantly.
What you will learn
- What a phase, a component and equilibrium mean in materials science.
- How the Gibbs phase rule limits what can change at the same time.
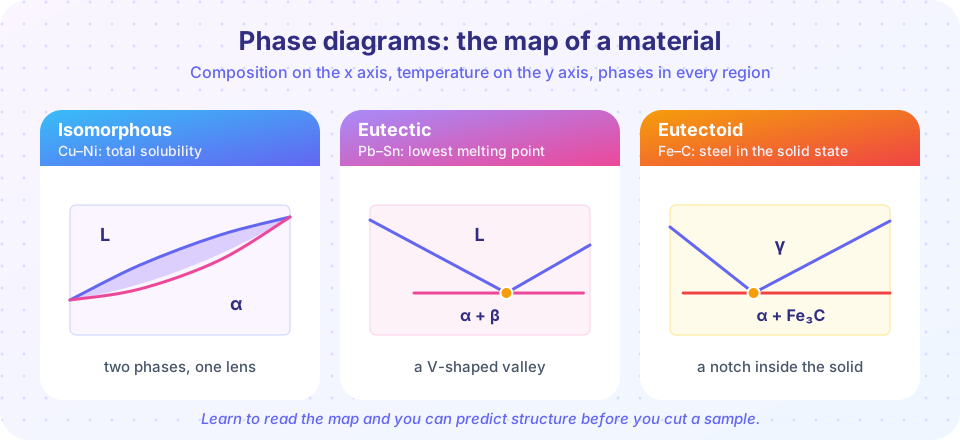
- Which three diagram shapes (isomorphous, eutectic, eutectoid) recur everywhere.
- Where you will use tie lines and the lever rule in the following lessons.
Key terms
Phase: a region of material with uniform structure and composition, separated from others by a boundary.
Component: an independent chemical species needed to describe the system, such as Cu and Ni.
Equilibrium: the state with the lowest free energy; it needs time and atomic mobility to be reached.
Solubility limit: the maximum amount of one element that a phase can dissolve at a given temperature.
The big picture
A pure substance such as water has a phase diagram with pressure and temperature on the axes. Alloys are almost always used at atmospheric pressure, so we freeze pressure and put composition on the horizontal axis instead. The vertical axis is temperature. Pick any point (an alloy of a given composition held at a given temperature) and the diagram tells you which phases are present, what each one is made of, and, with a simple calculation, how much of each there is.
That is a remarkable amount of information for a drawing. It is only valid for equilibrium, meaning the material has been held long enough that atoms have moved to where they want to be. Real parts are cooled quickly, so you will also meet the limits of the maps: diagrams tell you where a process is heading, not how fast it gets there. Chapter 6 adds the time axis with TTT diagrams.
What a phase diagram tells you
Three shapes to know
Where it leads
What is in the chapter
- Solid solutions, tie lines and the lever rule introduces the Gibbs phase rule and the Cu–Ni lens, then teaches the calculation you will use most: finding the amount of each phase.
- Eutectic systems covers Pb–Sn, the V-shaped valley, and the microstructures that grow from it.
- Chapter review pulls the chapter into one picture and tests it with ten questions.
Try it
Press Run (or Ctrl + Enter) to see the result here.
Program input · what you'd type while the program runs
Type the answers before you press Run, one per line. Each time the program reads a line (with input()), it gets the next line from this box.
Press Run (or Ctrl + Enter) to see the console output here.
No output.
Check your understanding
Quick check · 4 questions
of 4 answered You scored / 4 · perfect!
-
1. A phase diagram describes a material in which state?
Phase diagrams show the stable phases once the material has had time to reach equilibrium. They say nothing about how fast it gets there. -
2. What goes on the two axes of a binary alloy phase diagram at fixed pressure?
Pressure is held constant, so composition runs along the horizontal axis and temperature up the vertical axis. -
3. Which shape of diagram describes two metals that dissolve in each other completely?
Complete solubility in both liquid and solid gives the lens shape, as in Cu–Ni. -
4. Using F = C - P + 1 at fixed pressure, how many degrees of freedom does a binary alloy have in a two-phase region?
F = 2 - 2 + 1 = 1. Once you choose the temperature, the compositions of both phases are fixed.
Summary
- A phase diagram maps stable phases against composition and temperature at equilibrium.
- It tells you which phases exist, their compositions and, with the lever rule, their amounts.
- Three shapes recur: the lens, the eutectic V and the eutectoid notch.
- Real cooling can be faster than equilibrium, so diagrams are a guide to where a material is heading.
Track your progress
Create a free account to tick off lessons and pick up where you left off on any device.
of Materials Science lessons completed