


















Lesson 3 of 46 · Getting Started
Choosing Materials by Property
Learn to turn design requirements into material choices using property charts and performance indices such as E/density, with worked rod and beam examples.
A designer never asks "what is the best material?" The useful question is "what is the best material for this part, under these loads, at this cost?" The answer depends on what the part must do. A rod that pulls on a structure needs different properties from a panel that resists bending or a pot that must survive a stove. This lesson shows a simple method: translate the job into a property, read the property from a chart, and rank the candidates with a number.
What you will learn
- How to turn a design requirement into constraints, objectives and free variables.
- How to read a property chart in the style of Michael Ashby.
- How to derive a performance index for a rod and a beam.
- Why steel, aluminum and titanium are almost equal for stiffness-limited light rods.
Key terms
Constraint: a requirement that must be met, such as "does not yield" or "stiffness at least S".
Objective: the quantity to minimize or maximize, such as mass or cost.
Free variable: a design choice you may adjust, such as the cross-section area.
Performance index: a combination of material properties that is maximized to meet the objective, for example E/ρ.
Property charts
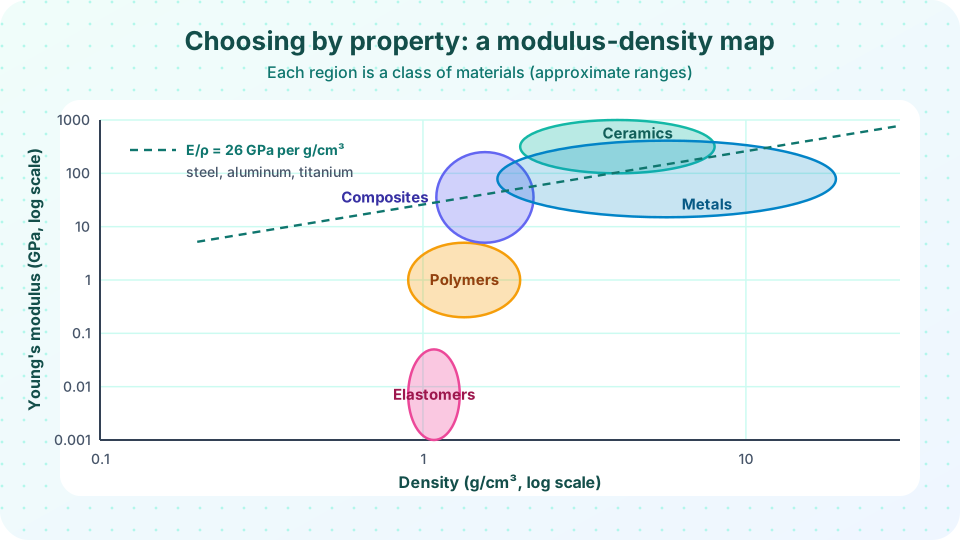
Plot one property against another on logarithmic axes and every material becomes a point, and every class of materials becomes a cloud. The picture above shows Young's modulus E (stiffness) against density ρ. Three things stand out. Properties of engineering materials span a wide range: more than five orders of magnitude in stiffness. Classes occupy distinct regions: polymers are light and compliant, ceramics are stiff and fairly light, metals are heavier. And a straight line with slope 1 on a log-log chart is a line of constant ratio E/ρ, which turns out to matter in lightweight design.
Because both axes are logarithmic, a power law becomes a straight line. A line E = C ρ^n has slope n. We use this to draw selection lines for different design problems.
From requirement to index
Every selection problem has three parts. The function is what the part does (carry a tensile load, resist bending). The constraints are non-negotiable limits (stiffness, strength, size). The objective is what you want to minimize (usually mass or cost). With these written down, you can often find one combination of properties that decides the ranking.
Example 1: a light, stiff tie rod. A rod of length L and cross-section area A must have axial stiffness S = A E / L. We may choose A freely. The mass is m = ρ A L. From the stiffness constraint A = S L / E, so
m = S L² (ρ / E).
S and L are fixed, so mass is smallest when ρ/E is smallest. The performance index to maximize is E / ρ, the specific stiffness.
Example 2: a light, stiff beam in bending. For a beam with a square section of side b, the second moment of area is I = b⁴ / 12 = A² / 12, and the bending stiffness is proportional to E I / L³. For a fixed stiffness A² ∝ S L³ / E, so A ∝ (S L³ / E)^(1/2). The mass m = ρ A L becomes
m ∝ ρ / E^(1/2),
so the index is E^(1/2) / ρ. Notice that the beam favors low density more strongly than the rod does, because shape (area spread away from the axis) helps.
Example 3: a light tie that must not yield. If the constraint is strength rather than stiffness, F = σ_y A, so A = F / σ_y and m = ρ L F / σ_y. The index is σ_y / ρ, the specific strength.
Different jobs, different indices. A material that wins one ranking can lose another, which is why a single "best" does not exist.
A worked ranking
Take typical values: steel (ρ = 7.85 g/cm³, E = 205 GPa, σ_y = 350 MPa), aluminum alloy 6061-T6 (2.70, 69, 275), titanium alloy Ti-6Al-4V (4.43, 114, 880), and a unidirectional carbon-fiber composite loaded along the fibers (1.6, 135, about 1000). In the rod problem E/ρ is about 26 GPa per g/cm³ for steel and also about 26 for aluminum, and about 26 for titanium. They are essentially tied, as the dashed line on the chart shows. Carbon fiber is about three times better at roughly 84. For the strength-limited rod, titanium (σ_y/ρ ≈ 199) beats aluminum (≈ 102) and steel (≈ 45).
This explains real design choices. Aircraft primary structures use aluminum, titanium and carbon-fiber composites for strength per mass. Bridges and buildings use steel, because mass matters little and steel is cheap and easy to join.
Press Run (or Ctrl + Enter) to see the result here.
Program input · what you'd type while the program runs
Type the answers before you press Run, one per line. Each time the program reads a line (with input()), it gets the next line from this box.
The second experiment finds how much material a 1 m rod needs for a fixed stiffness, so the index turns into kilograms.
Press Run (or Ctrl + Enter) to see the console output here.
No output.
Beyond mass
Real selection includes more constraints: cost per kilogram, availability, recyclability, corrosion resistance, operating temperature, joining and manufacturing routes. Experts apply screening first (drop materials that cannot meet a hard limit, such as a service temperature above 600 °C), then ranking with an index, then check the top few against remaining requirements and ask for local supplier information. The software that does this uses the same logic as the chart above.
Common misconceptions
"The strongest material is the right choice." Only if strength per mass or per cost is the objective. A stiffness-limited part is not helped by a stronger alloy of the same stiffness.
"Aluminum makes a lighter rod than steel because it is lighter." For a stiffness-limited rod, the aluminum rod must be thicker (E is three times lower) and the mass comes out about the same.
"If two materials are close on the chart, they are interchangeable." They may differ greatly in cost, toughness, corrosion, or how easily they can be joined.
Check your understanding
Quick check · 5 questions
of 5 answered You scored / 5 · perfect!
-
1. For a tie rod of fixed length and required stiffness, which index should be maximized to minimize mass?
m = S L² (ρ / E), so the lightest rod has the largest E/ρ. -
2. A line of slope 1 on a log-log plot of E against ρ represents
E = Cρ is a straight line of slope 1 on log axes, and C = E/ρ is constant along it. -
3. For a stiff, light beam in bending, the index is
Area scales with (1/E)^(1/2) for fixed bending stiffness, so mass scales with ρ / E^(1/2). -
4. Steel, aluminum and titanium alloys are nearly tied on which measure?
All three have E/ρ of about 26 GPa per g/cm³. -
5. What is the purpose of screening in selection?
Screening eliminates candidates that cannot meet a limit, so ranking is done only on viable ones.
Summary
- Selection starts from function, constraints and objective, not from a favorite material.
- Log-log property charts show material classes as regions and design criteria as straight lines.
- Light, stiff rods use
E/ρ; light, stiff beams useE^(1/2)/ρ; light, strong ties useσ_y/ρ. - Steel, aluminum and titanium tie on specific stiffness; carbon-fiber composites beat them in the fiber direction.
- Real choices add cost, corrosion, temperature and manufacturing constraints.
Next: Units and Length Scales
Track your progress
Create a free account to tick off lessons and pick up where you left off on any device.
of Materials Science lessons completed