


















Lesson 7 of 49 · Overview and Materials
Mechanical Properties for Manufacturing
Read a stress-strain curve, convert engineering to true stress and strain, use the flow curve K times strain to the n, and see why hardness and ductility steer process choice.
When you push a lump of metal into a die, how hard must you push? When you bend a strip of sheet, will it crack? When a cutter slices a chip, how big is the cutting force? Each of these questions is answered by a handful of mechanical properties measured in a tensile test. The same few curves explain why soft copper bends into a bracket, why a quenched steel file shatters when dropped, and why forming gets harder the more you do it. This lesson turns the tensile test into a toolkit for manufacturing.
What you will learn
- Compute engineering stress and strain and read yield strength, tensile strength and ductility.
- Convert to true stress and true strain, and explain why the difference matters in forming.
- Use the flow curve
σ = K ε^nto estimate the stress needed to keep deforming a metal. - Relate hardness to strength and to machinability.
Key terms
Stress (σ): force divided by the original cross-section area, in pascals (Pa) or megapascals (MPa).
Strain (e): change in length divided by original length; dimensionless.
Yield strength: the stress at which permanent (plastic) deformation begins.
Ultimate tensile strength (UTS): the maximum engineering stress the specimen reaches.
Strain hardening: the increase of strength as a metal is deformed plastically.
The tensile test
A standard specimen is gripped in a testing machine and pulled at a steady rate. The machine records force F and extension ΔL. Dividing by the original dimensions gives the engineering quantities:
σ_eng = F / A₀, e = ΔL / L₀
Suppose a round steel bar has diameter 12.5 mm, so A₀ = π × 6.25² = 122.7 mm², and a gauge length L₀ = 50 mm. If it yields at 30.7 kN, then σ_y = 30,700 N / 122.7 mm² = 250 MPa. If the maximum force is 49 kN, UTS = 49,000 / 122.7 = 399 MPa.
Reading the curve
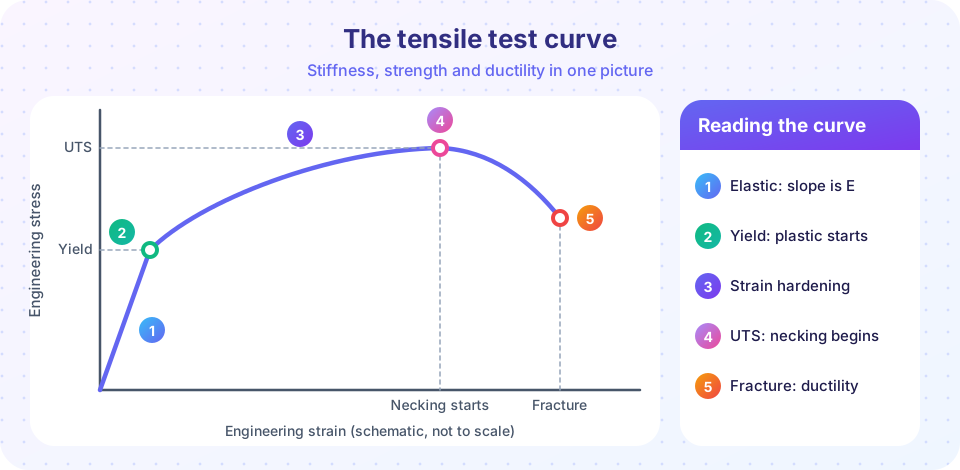
- Elastic region. The line is straight:
σ = E e. Release the load and the bar returns to its original length. For steelE ≈ 200 GPa, so at 250 MPa the strain is only250 / 200,000 = 0.00125, or 0.125 percent. - Yield. Past the yield point the bar deforms permanently. Many metals have no sharp yield, so engineers define the 0.2 percent offset yield strength: draw a line parallel to the elastic line starting at a strain of 0.002 and find where it meets the curve.
- Strain hardening. The curve keeps rising because dislocations in the crystal tangle and make further slip harder.
- UTS and necking. At the peak the bar starts to form a local neck. Beyond this the engineering stress falls, because the force drops faster than we account for the shrinking area.
- Fracture. The bar breaks. The ductility is measured by percent elongation
100 (L_f - L₀) / L₀or percent reduction of area100 (A₀ - A_f) / A₀.
Engineering versus true stress and strain
The engineering curve falls after the peak, which seems to say the metal gets weaker. It is a bookkeeping artifact: the area is shrinking, but we keep dividing by A₀. True stress uses the instantaneous area, and true strain adds up small increments of strain:
σ_true = F / A = σ_eng (1 + e) and ε = ln(1 + e)
(The first relation assumes constant volume and uniform deformation, so it is valid only up to necking.) True stress keeps rising until fracture, and true strain makes strains add up properly: stretching a bar to twice its length and then again to twice that gives a total length of four times, so ε is ln 2 + ln 2 = ln 4. Forming engineers prefer true quantities because deformation in manufacturing is large.
The flow curve
In the plastic region many metals follow the Hollomon equation, also called the flow curve:
σ_f = K ε^n
K is the strength coefficient (MPa) and n is the strain-hardening exponent (dimensionless, between 0 and 1). The flow stress is the stress needed to continue deforming the metal at strain ε. Typical handbook-style values for annealed metals are around:
| Metal (annealed) | K (MPa) | n |
|---|---|---|
| Aluminum 1100 | 180 | 0.20 |
| Low-carbon steel | 530 | 0.26 |
| 70/30 brass | 900 | 0.49 |
Use them as classroom numbers; real values depend on the exact alloy and condition.
Worked example
How much stress is needed to compress low-carbon steel to a true strain of 0.5? σ_f = 530 × 0.5^0.26. Since ln 0.5 = -0.693, 0.26 × -0.693 = -0.180 and e^-0.180 = 0.835. So σ_f = 530 × 0.835 = 443 MPa.
The average flow stress over a whole deformation from zero to ε is Ȳ_f = K ε^n / (1 + n). For the same example: 443 / 1.26 = 351 MPa. This is the number a forging force estimate uses in the next chapter.
A neat fact: necking begins when the true strain equals n. Metals with high n (like brass, n = 0.49) stretch a long way before necking, so they are good for deep drawing and stretching. Metals with low n neck early and tear.
Hardness
Hardness measures resistance to indentation. A hard indenter is pressed into the surface and the size or depth of the dent is converted to a number.
- Brinell (HB): a hardened ball, load divided by the dent's surface area. Common for castings and forgings.
- Rockwell (HRB, HRC): the depth of the dent under a major load. Rockwell C is the usual scale for hardened steel.
- Vickers (HV): a diamond pyramid, usable from very soft to very hard materials.
For many steels, UTS in MPa is roughly 3.45 × HB, so a hardness test is a quick, nearly non-destructive estimate of strength. In machining, harder material generally wears tools faster, but very soft and gummy metals (pure aluminum, some stainless steels) can cause trouble too, because they smear and form built-up edge.
Why manufacturing cares
- Forming forces scale with flow stress. Cold working hardens a metal, so later passes take more force (and a softening anneal may be needed).
- Formability depends on ductility and n. A material that necks at low strain cannot be stretched much.
- Springback after bending is larger for high-yield, low-modulus materials.
- Machinability depends on hardness, microstructure and thermal conductivity.
- Cold working is also a strengthening tool: a drawn wire is stronger than the annealed rod it came from.
Common misconceptions
"Higher UTS means a stronger part in every way." A material with high UTS may be brittle and fail suddenly; many designs value toughness or fatigue resistance more.
"The engineering curve drops after the peak because the metal gets weaker." The metal keeps hardening; the drop comes from dividing by the original area.
"Yield and tensile strength are the same." Yield marks the start of permanent deformation; UTS marks the maximum load. They can differ a lot, especially in soft, work-hardening metals.
Try it
Plot the true flow curve and the matching engineering curve for any K and n. The peak of the engineering curve lands exactly at ε = n.
Press Run (or Ctrl + Enter) to see the result here.
Program input · what you'd type while the program runs
Type the answers before you press Run, one per line. Each time the program reads a line (with input()), it gets the next line from this box.
The second example is an interactive tensile calculator. Enter the test data and it reports the standard properties. It is a calculator for the formulas, not a testing machine.
Check your understanding
Quick check · 5 questions
of 5 answered You scored / 5 · perfect!
-
1. A bar with cross-section 100 mm² yields at 25 kN. What is the yield strength?
25,000 N / 100 mm² = 250 N/mm² = 250 MPa. -
2. A bar is stretched from 100 mm to 120 mm. What is the engineering strain and the true strain?
e = 20/100 = 0.20 and ε = ln(1.2) = 0.182. -
3. In σ = K ε^n, what does a high value of n mean?
High n means strong strain hardening and a larger strain before necking starts. -
4. At what true strain does necking begin in a Hollomon material?
Necking begins at the maximum load, which for σ = K ε^n occurs when ε = n. -
5. Which test is the standard way to quickly estimate the strength of a hardened steel part?
Hardness is quick and almost non-destructive, and it correlates with tensile strength in steels.
Summary
- Engineering stress is
F / A₀, strain isΔL / L₀; the curve gives E, yield, UTS and ductility. - True stress and strain account for the shrinking area; true strain is
ln(1 + e). - The flow curve
σ = K ε^npredicts the stress needed during large plastic deformation; necking starts at ε = n. - Hardness quickly estimates strength and informs machinability.
- Forming forces, springback and machinability all follow from these properties.
Track your progress
Create a free account to tick off lessons and pick up where you left off on any device.
of Manufacturing Processes lessons completed