


















Lesson 42 of 49 · Quality, Automation and Lean
Lean manufacturing, takt time and OEE
The core of lean production: eight wastes, takt time and line balance, OEE, Little's law, kanban card counts and SMED setup reduction, each with worked numerical examples.
Walk through almost any factory and ask how long a part takes to go from raw material to shipped product. The answer is often days or weeks. Now ask how long the part is actually being worked on. Usually it is minutes. For the rest of the time the part waits: in a pile before a machine, in a warehouse, in a truck, in a queue for inspection. Lean manufacturing starts from this observation and asks a simple question about every step: does it add value the customer would pay for? If not, it is waste, and the job is to remove it.
What you will learn
- The origins of lean in the Toyota Production System and its main tools.
- How to compute takt time and judge line balance.
- How to calculate OEE and what to do with it.
- How Little's law links work in process, throughput and lead time.
- How kanban limits inventory, and how SMED makes small batches economical.
Key terms
Takt time: the available production time divided by customer demand; the pace at which a unit must be completed to meet demand.
Cycle time: the time a station needs to complete its work on one unit.
OEE: overall equipment effectiveness: availability × performance × quality.
WIP: work in process, the units that have started but not finished.
Kanban: a signal (a card or a bin) that authorizes production or movement of parts only when downstream needs them.
Where lean comes from
After the Second World War, Toyota had small markets, little capital and many models to build, so it could not copy the mass-production giants. Taiichi Ohno, Shigeo Shingo and colleagues built a system around two pillars:
- Just-in-time: make only what is needed, when it is needed, in the amount needed, so that inventory does not hide problems.
- Jidoka ("automation with a human touch"): machines stop themselves when something goes wrong, so defects are not passed on and people can fix the cause.
In the 1980s and 1990s researchers at MIT studied these methods and called them "lean", and the ideas spread worldwide and beyond cars.
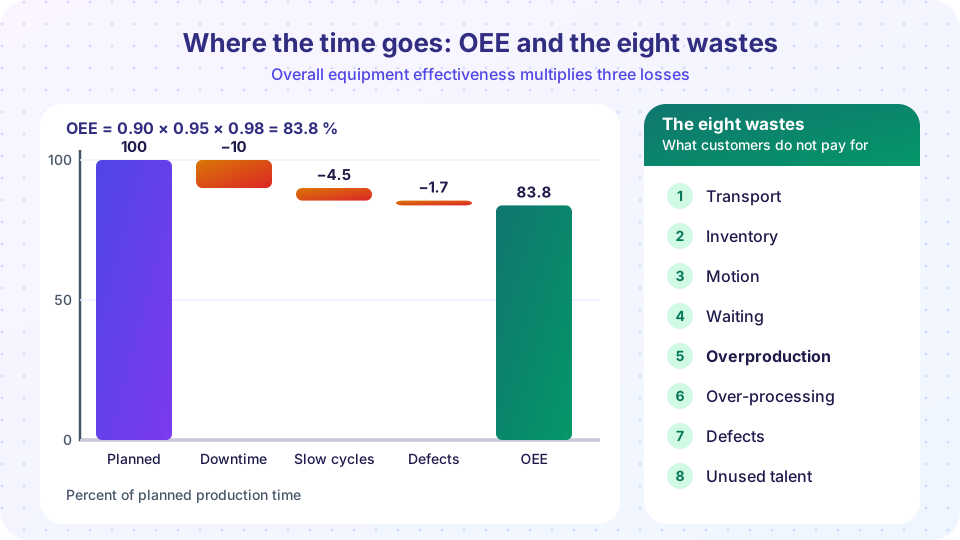
The eight wastes
- Transport: moving materials further or more often than necessary.
- Inventory: raw material, WIP or finished goods beyond what is needed now.
- Motion: walking, bending and reaching because the workplace is poorly arranged.
- Waiting: people or machines idle for material, information or repair.
- Overproduction: making more, or sooner, than required. Ohno called it the worst waste because it causes the others.
- Over-processing: more machining, finishing or inspection than the customer needs.
- Defects: scrap and rework.
- Unused talent: not using people's ideas and skills.
Takt time and line balance
Takt time (from the German word for a beat) is the pace set by demand:
takt time = available production time / customer demand
Worked example 1
A shift of 8 hours has 30 minutes of breaks, so the available time is 450 min = 27,000 s. Demand is 900 units per shift:
takt = 27,000 / 900 = 30 s per unit.
Every station must finish in no more than 30 s on average. If the slowest station (the bottleneck) needs 36 s, the line makes only 27,000 / 36 = 750 units, which is 150 short. Options: speed up the bottleneck, move work from it to a neighbor with spare time (line balancing), add a parallel station, or add overtime. Improving a non-bottleneck station adds nothing to output.
OEE
Overall equipment effectiveness shows how much of the planned time a machine produces good parts at full speed:
OEE = Availability × Performance × Quality
Availability = run time / planned time
Performance  = (ideal cycle time × total count) / run time
Quality      = good count / total count
Worked example 2
A machine is planned to run 480 min and is down 48 min for breakdowns and changeovers, so Availability = 432 / 480 = 0.90. Its ideal cycle time is 0.5 min, and it made 821 units, so Performance = 0.5 × 821 / 432 = 0.95. Of these units 805 were good: Quality = 805 / 821 = 0.98. Rounding each factor, OEE = 0.90 × 0.95 × 0.98 ≈ 0.84, which is about 84 percent.
Each factor is tied to losses: availability to breakdowns and changeovers, performance to slow cycles and small stops, quality to scrap and rework. An OEE of 85 percent is often quoted as a world-class benchmark for discrete manufacturing, though it should be compared with your own history rather than other plants. Use it as a diagnostic, not a ranking: it shows where to look first. Note that OEE applies to the machines that limit output; raising the OEE of a machine that is not the bottleneck may not raise the plant's output.
Little's law
For any stable flow, the average amount of work in process equals the throughput times the average time a unit spends in the system:
WIP = throughput × lead time
Worked example 3
A cell finishes 60 units per hour and the average unit spends 2 hours inside: WIP = 60 × 2 = 120 units. To cut the lead time to 1 hour at the same throughput, the WIP must be halved to 60 units. This explains why lean attacks inventory: less WIP is shorter lead time, faster feedback on quality problems and less cash tied up in stock.
Kanban
In a pull system, production at a station starts only when the downstream station consumes parts. A card or an empty container is the signal. The number of cards limits the inventory between two stations:
N = demand rate × lead time × (1 + safety) / container size
With a demand of 120 parts/h, a replenishment lead time of 0.5 h, 10 percent safety and containers of 20: N = 120 × 0.5 × 1.1 / 20 = 3.3, rounded up to 4 cards. Reducing the lead time or the variation allows fewer cards, so kanban makes problems visible and gives a target for improvement.
SMED: making small batches possible
Large batches exist because changeovers are slow: if setting up the machine takes an hour, you run big lots to spread the setup cost. The classical economic batch size is:
Q* = √(2 D S / H)
with annual demand D, setup cost S per batch and holding cost H per unit per year. Shigeo Shingo's SMED (single-minute exchange of die) method cuts setup time by moving as much work as possible outside the stop (prepare tools and material while the machine is still running), standardizing fixtures, and eliminating adjustments. With D = 12,000 units a year, H = $2 and setup cost S = $200: Q* = √(2 × 12,000 × 200 / 2) ≈ 1,549. If SMED reduces the setup cost to $33: Q* ≈ 629. Smaller batches mean less inventory, shorter lead time, and more responsiveness to demand.
5S, poka-yoke and kaizen
- 5S: sort, set in order, shine, standardize, sustain. A tidy, labelled workplace removes searching and makes abnormalities visible.
- Poka-yoke: mistake-proofing, such as a fixture in which a part fits only one way or a sensor that stops the machine if a hole is missing.
- Kaizen: continuous improvement by small steps, by everyone, every day.
- Value stream mapping: drawing every step from supplier to customer with times, to see waiting and waste. A typical result is a value-added ratio of a few percent: a part with 12 minutes of real work that takes 5 working days (2,400 minutes) to flow through has a ratio of
12 / 2,400 = 0.5%.
Common misconceptions
"Lean is just cost cutting." Lean aims at flow and value. Cutting resources without removing the causes of waste usually brings it back.
"High machine utilization is always good." Running a non-bottleneck machine at full speed only creates inventory. What counts is the output of the whole system.
"Zero inventory means no inventory." It is a direction, not a literal target. Buffers sized by kanban protect against variation.
Try it
First, balance a line. Set the demand and the station times; stations slower than the takt time turn red.
Then compute OEE, Little's law, kanban cards and the effect of SMED on batch size, and plot the batch size against setup cost.
Press Run (or Ctrl + Enter) to see the result here.
Program input · what you'd type while the program runs
Type the answers before you press Run, one per line. Each time the program reads a line (with input()), it gets the next line from this box.
Check your understanding
Quick check · 5 questions
of 5 answered You scored / 5 · perfect!
-
1. A line has 420 minutes of available time and demand of 700 units. What is the takt time?
420 min = 25,200 s. Takt = 25,200 / 700 = 36 s per unit. -
2. A machine has Availability 0.88, Performance 0.92 and Quality 0.97. What is the OEE?
OEE = 0.88 × 0.92 × 0.97 = 0.785, about 79 percent. -
3. Throughput is 40 units/h and average lead time is 3 h. By Little's law, what is the WIP?
WIP = throughput × lead time = 40 × 3 = 120 units. -
4. Which waste did Taiichi Ohno consider the worst because it causes the others?
Overproduction leads to excess inventory, extra transport, storage and hidden defects. -
5. What does SMED aim to reduce?
SMED cuts setup and changeover time, which makes small batches economical.
Summary
- Lean removes waste (eight kinds) to improve flow; its roots are just-in-time and jidoka at Toyota.
- Takt time = available time / demand; the bottleneck sets the output of a line.
- OEE = availability × performance × quality, a diagnostic of machine losses.
- Little's law:
WIP = throughput × lead time; less WIP means a shorter lead time. - Kanban limits inventory with
N = demand × lead time × (1 + safety) / container size; SMED shrinks economic batch sizes by cutting setup cost.
Track your progress
Create a free account to tick off lessons and pick up where you left off on any device.
of Manufacturing Processes lessons completed