


















Lesson 13 of 46 · Fatigue and Failure
Fatigue and the S-N Curve
See how fatigue cracks start, grow and snap a part, read the S-N curve, estimate the endurance limit and finite life with Basquin's equation, and add damage with Miner's rule.
Bend a paper clip once and nothing happens. Bend it back and forth ten times and it snaps, even though you never pushed hard. That is fatigue: a material that survives a single load can fail under a smaller load applied again and again. Metals do the same, only more slowly and with far more serious consequences. A crack starts at a tiny flaw, grows a little with every cycle, and when the remaining section can no longer carry the load, the part breaks in an instant.
Fatigue is why rotating shafts, springs, gear teeth, connecting rods, aircraft wings and bridges are designed so carefully. This lesson explains how a fatigue failure unfolds, shows how engineers measure and plot fatigue strength, and gives you the equations to estimate how many cycles a part will survive.
What you will learn
- The three stages of a fatigue failure and what a fatigue fracture looks like.
- How the S-N curve is measured and what the endurance limit means.
- How to estimate finite life with
Sf = a Nᵇ. - How to add up damage from different stress levels with Miner's rule.
Key terms
- Fatigue: progressive failure from repeated stress cycles, at stresses often below the yield strength.
- S-N curve: a plot of stress amplitude
Sagainst the number of cycles to failureN. - Endurance limit Se: the stress amplitude below which a steel appears to last for an unlimited number of cycles.
- Fatigue strength Sf: the stress amplitude that causes failure at a stated number of cycles.
- Miner's rule: a method of adding damage
n/Nfrom different stress levels, failure at a sum of about 1.
How a fatigue failure unfolds
Stage 1: crack initiation. Under repeated stress, tiny regions of the surface slip back and forth in slip bands. Eventually a microscopic crack forms, almost always at the surface, and almost always at a stress concentration: a scratch, a sharp fillet, a keyway corner, a corrosion pit, a weld toe, an inclusion. A smooth, polished part takes longer to start a crack.
Stage 2: crack propagation. The crack grows a little with each cycle, because the stress at its sharp tip is far above the average. The rate is tiny, a fraction of a micrometer per cycle, but over thousands or millions of cycles the crack becomes visible. The fracture surface shows smooth, curved beach marks (also called clamshell marks) radiating from the origin, where the crack paused or changed speed, as with the ripples on a beach.
Stage 3: final fracture. When the uncracked section is too small to carry the load, it fails suddenly, by yielding or brittle fracture. This region looks rough, like a normal overload fracture. The fraction of the surface that is smooth tells you something about the stress: a small rough area means the part was very lightly loaded when it finally broke, and a large rough area means high stress.
There is no warning: the part does not visibly bend or stretch before it breaks. That is what makes fatigue dangerous, and why inspections look for cracks rather than for deformation.
Measuring fatigue: the S-N curve
In the 1850s and 60s, August Wöhler tested railway axles under repeated bending and plotted the stress against the number of cycles to failure. The modern standard is the rotating-beam test (R. R. Moore machine): a highly polished specimen, about 7.6 mm in diameter, is loaded as a beam in pure bending and rotated, so every point on the surface goes through a completely reversed cycle once per turn. Several specimens are tested at different stresses until they break, and the points make the S-N curve. Because fatigue life scatters widely (by a factor of ten or more at the same stress), the curve is a statistical result, typically the median.
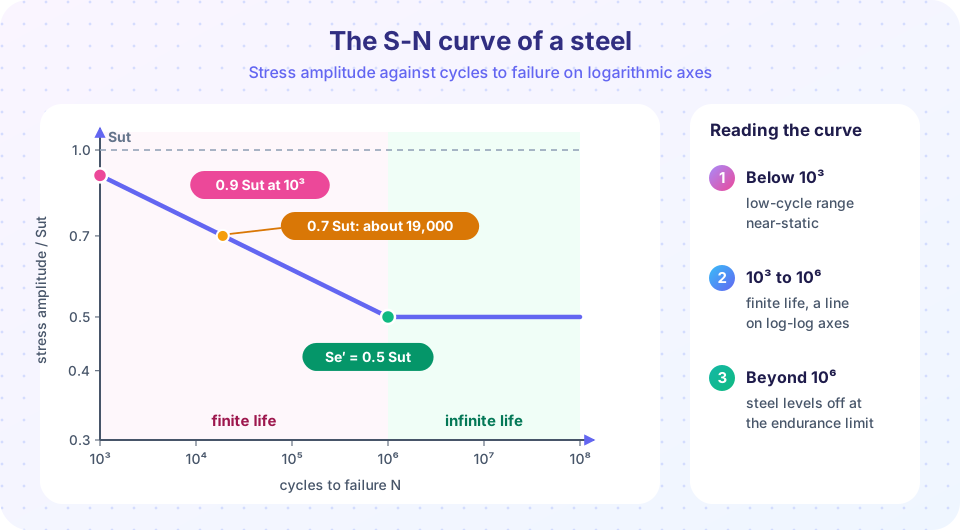
For steels the curve has a clear shape.
- Below about 10³ cycles (low-cycle fatigue) the stress is close to the static strength, and plastic deformation matters. Designers treat it as a static problem or use strain-based methods.
- Between 10³ and about 10⁶ cycles (high-cycle, finite life) the curve slopes down steadily; on log-log axes it is almost a straight line.
- Beyond about 10⁶ cycles many steels show a knee and then a flat line: the endurance limit
Se′. Below it, the specimen survives indefinitely.
For wrought steels with Sut ≤ 1,400 MPa the endurance limit of the polished specimen is approximately
Se′ ≈ 0.5 Sut (and about 700 MPa for Sut above 1,400 MPa)
For a steel with Sut = 630 MPa, Se′ ≈ 315 MPa. Aluminum, copper and most non-ferrous alloys have no endurance limit: the curve keeps falling, and designers quote the fatigue strength at a chosen life such as 5 × 10⁸ cycles. A corrosive environment also removes the endurance limit of steel.
Estimating finite life
Between 10³ and 10⁶ cycles the straight line on log-log axes gives Basquin's equation:
Sf = a Nᵇ
a = (f Sut)² / Se
b = −(1/3) log10( f Sut / Se )
N = (σa / a)^(1/b)
Here Se is the (corrected) endurance limit of the real part, f is the fraction of Sut that the fatigue strength has reached at 10³ cycles (about 0.9 for steels with Sut up to about 500 MPa, somewhat lower for stronger steels, so 0.9 is an optimistic first estimate), and σa is the completely reversed stress amplitude on the part. The line passes through 0.9 Sut at 10³ and Se at 10⁶.
Example. A steel with Sut = 630 MPa has a corrected endurance limit Se = 181 MPa (you will compute this in the next lesson). With f = 0.9: a = (0.9 × 630)² / 181 = 1,776 MPa and b = −(1/3) log10(567/181) = −0.165. A completely reversed stress amplitude of 300 MPa gives N = (300/1,776)^(1/−0.165) ≈ 47,000 cycles. At 250 MPa it is about 140,000 cycles; at 200 MPa about 550,000; and at 181 MPa, one million. A reduction of stress by one third multiplies the life by about twenty.
Press Run (or Ctrl + Enter) to see the result here.
Program input · what you'd type while the program runs
Type the answers before you press Run, one per line. Each time the program reads a line (with input()), it gets the next line from this box.
Mixed stress levels: Miner's rule
Real parts see different stress levels over their life. Palmgren and Miner proposed that each cycle at stress σi uses up a fraction 1/Ni of the life, and that failure occurs when the fractions add up to one:
D = Σ ( nᵢ / Nᵢ ) failure when D ≈ 1
Take the shaft above. It runs 20,000 cycles at 300 MPa (N = 47,000) and 100,000 cycles at 250 MPa (N = 142,000). Damage D = 20,000/47,000 + 100,000/142,000 = 0.43 + 0.70 = 1.13. The rule predicts failure. Miner's rule ignores the order of loading (a high stress first, then low, is actually more damaging than the reverse) and is only a rough guide. Experiments show failure between about D = 0.3 and 3, so designers often keep D below 0.5 for important parts.
Press Run (or Ctrl + Enter) to see the result here.
Program input · what you'd type while the program runs
Type the answers before you press Run, one per line. Each time the program reads a line (with input()), it gets the next line from this box.
The block at 150 MPa adds nothing, because it is below the endurance limit. This is the idea behind "infinite life" design: keep the stress below the (corrected!) endurance limit and the stress cycles never accumulate damage. Strictly, in real service occasional overloads above the limit can start cracks that then grow at lower stresses, which is why designers keep a margin.
Common misconceptions
- "If a part has lasted ten years, it is safe forever." Not if it is slowly growing a crack. Inspection for cracks is the safeguard.
- "The endurance limit is a material constant." It is the limit for a polished laboratory specimen. The real part's limit is usually only 30 to 60 percent of it (next lesson).
- "Fatigue only matters for moving machinery." Bridges, pressure vessels, wind turbines and aircraft fuselages see repeated loading too.
Check your understanding
Quick check · 5 questions
of 5 answered You scored / 5 · perfect!
-
1. Where does a fatigue crack almost always start?
Surface features such as scratches, fillets and notches concentrate stress and start the crack. -
2. What are beach marks?
They radiate from the origin and record where the crack paused or changed speed. -
3. A steel has Sut = 800 MPa. What is its laboratory endurance limit, approximately?
Se′ ≈ 0.5 Sut = 400 MPa for steels with Sut ≤ 1,400 MPa. -
4. Which materials typically have no endurance limit?
Aluminum and other non-ferrous alloys keep losing strength with more cycles, so a fatigue strength at a stated life such as 5×10⁸ cycles is used. -
5. A part sees 30,000 cycles at a stress where N = 60,000 and 40,000 cycles at a stress where N = 200,000. What is Miner's damage sum?
D = 30,000/60,000 + 40,000/200,000 = 0.5 + 0.2 = 0.7.
Summary
- Fatigue: crack initiation at the surface, propagation with beach marks, sudden final fracture, with no warning.
- The S-N curve is measured with rotating-beam specimens; steel shows an endurance limit near
0.5 Sut; non-ferrous metals do not. - Finite life:
Sf = a Nᵇ,a = (f Sut)²/Se,b = −(1/3) log10(f Sut/Se). - Miner's rule adds damage
Σ nᵢ/Nᵢ, with failure near 1; stresses belowSeadd no damage.
Track your progress
Create a free account to tick off lessons and pick up where you left off on any device.
of Machine Design lessons completed