


















Lesson 46 of 50 · Projects and Practice
Project: A Recall Experiment from Design to Report
A guided mini-project: design a levels-of-processing experiment, simulate the data, run a t-test, compute effect size and confidence interval, check power and write a short report.
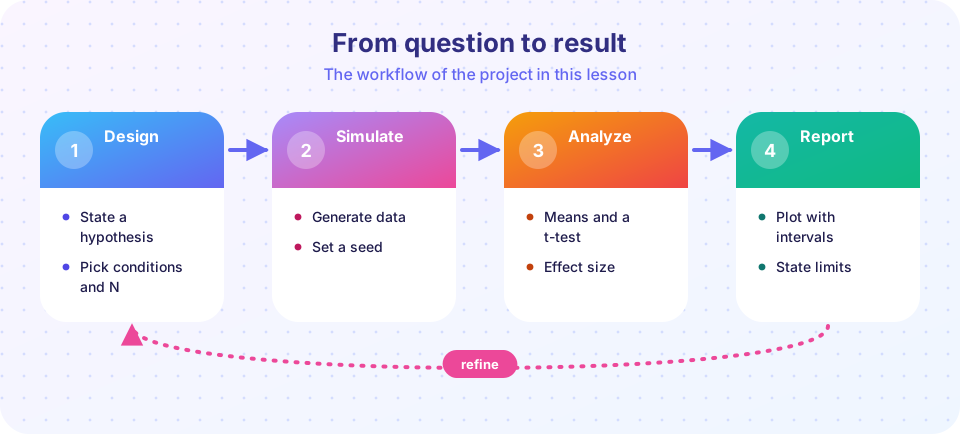
You have read about experiments for several chapters. In this project you design one, simulate it, analyze it and write it up, all in code you can run in your browser. The question comes from chapter 5: does deeper processing of words lead to better recall? The data are simulated, with numbers we choose, so what you learn is the workflow and the statistics, not a new fact about memory. A real study would replace the simulation step with participants.
What you will learn
- How to turn a research question into a hypothesis, conditions and a measure.
- How to simulate data and analyze it with a t-test, effect size and confidence interval.
- How to use a power analysis to choose a sample size.
- How to write a short, honest report with limitations.
Key terms
Independent variable: what you manipulate (here, the processing task).
Dependent variable: what you measure (here, words recalled).
Cohen's d: the difference between means in units of the standard deviation.
Confidence interval: a range of plausible values for the true difference.
Power: the chance of detecting an effect of a given size with a given sample.
Step 1: Design
Question. Does processing words for meaning produce better recall than processing them for letter shape?
Hypothesis. People who judge whether each word is pleasant (deep processing) will recall more words than people who judge whether it contains the letter e (shallow processing).
Design. Between-subjects: each participant is in one group, so no one sees both tasks. Participants study 20 words, one at a time, make the judgment, then do a short distraction task and attempt free recall. The independent variable is the processing task, the dependent variable is the number of words recalled (0 to 20). To keep the comparison fair, words should be the same list for both groups, with random assignment to groups, and recall scored by someone who does not know the condition.
Predicted pattern. Deep greater than shallow. A good habit is to say how large an effect you expect and why. We will assume a difference of about 3 words with a standard deviation of about 3, so d is about 1; this is on the generous side compared with real data and is chosen only to make the demonstration clear.
Step 2: Simulate and analyze
The code below simulates 30 participants per group, runs a Welch t-test, and reports the difference, Cohen's d and a 95% confidence interval. Change the numbers to see how the results move. Because the data are random, they change if you change the seed.
Press Run (or Ctrl + Enter) to see the result here.
Program input · what you'd type while the program runs
Type the answers before you press Run, one per line. Each time the program reads a line (with input()), it gets the next line from this box.
Step 3: How many participants? Power analysis
A common mistake is to run whatever number of participants is convenient. A power analysis asks: if the true effect is this big, how many participants do I need to detect it most of the time (usually 80 percent)? The code below finds this by simulation for different assumed effect sizes.
Press Run (or Ctrl + Enter) to see the result here.
Program input · what you'd type while the program runs
Type the answers before you press Run, one per line. Each time the program reads a line (with input()), it gets the next line from this box.
Step 4: Report
A short report has five parts. Here is a model, using the first simulation:
- Question and hypothesis. Does semantic processing improve free recall compared with structural processing? We predicted more words recalled after the deep task.
- Method. Simulated between-subjects experiment; 30 per group; 20 words; recall out of 20. (In a real study: how participants were recruited, how words were chosen, the exact instructions and timing.)
- Results. Report means and standard deviations, the difference with its 95% confidence interval, the test statistic and p-value, and the effect size. Include a figure that shows individual data points.
- Interpretation. Say what the results do and do not show. A confidence interval that excludes zero indicates a difference larger than chance would usually produce; it does not say why it exists.
- Limitations. Here, the data are simulated and the effect size assumed. In a real study, mention sample, task, measure and generalization. Suggest the next step: a replication with a different word list, or a delayed test.
Avoid claims that outrun the data: say "the deep group recalled more words", not "deep processing is always better".
Common misconceptions
"A small p-value shows that the effect is large." The p-value depends on sample size; report the effect size and interval.
"A non-significant result means no effect." It may mean low power.
"More participants is always better." More is better for precision, but the design and measures matter more than sheer numbers.
Check your understanding
Quick check · 5 questions
of 5 answered You scored / 5 · perfect!
-
1. In this design, the independent variable is
The independent variable is what the researcher manipulates. -
2. Cohen's d expresses a difference between means in units of
d is the mean difference divided by the pooled standard deviation. -
3. A power analysis is used to
It estimates the probability of detecting the effect for a given n. -
4. Which statement is appropriate in a report of one experiment?
Claims should stay within the data. -
5. Why might a study with a non-significant result still be informative?
Interval estimates show what effects are compatible with the data.
Summary
- A project moves from question and hypothesis, through design, simulation and analysis, to a report with honest limitations.
- Report the effect size and a confidence interval, not just a p-value, and show individual data.
- Power analysis helps choose a sample size; small effects need many more participants.
- Simulated data teach the workflow, but only real participants can answer the research question.
Track your progress
Create a free account to tick off lessons and pick up where you left off on any device.
of Cognitive Psychology lessons completed