


















Lesson 11 of 50 · Methods and Cognitive Architecture
Chapter 2 Review: Methods and Architecture
Review reaction-time methods, experimental design, neuroscience techniques and computational models with a one-page summary, recap table and ten-question quiz.
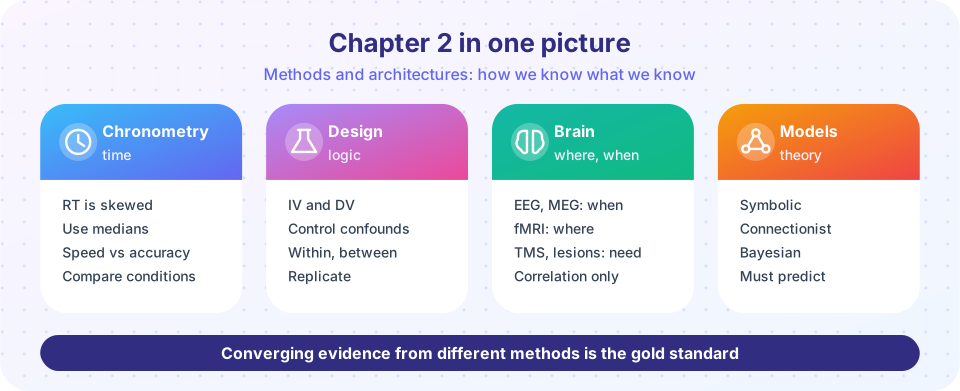
This chapter gave you the toolbox: how to time mental processes, how to design a fair experiment, how to look at the brain, and how to turn a theory into a model. The summary picture and table below put the pieces side by side, and the quiz checks that they stick.
What you will review
- How RT data are collected and summarized.
- How experiments are designed and analyzed.
- What each brain method can and cannot show.
- The three families of computational model.
Recap table
| Topic | Remember this | Names |
|---|---|---|
| Mental chronometry | RT is right-skewed; use medians; check accuracy; stages can be timed by subtraction (with a pure-insertion assumption) or additive factors | Donders 1868, Sternberg 1966 and 1969 |
| Hick's law | RT grows with log2(n + 1) | Hick 1952, Hyman 1953 |
| Decision models | Evidence accumulates to a boundary: more caution means slower and more accurate | Ratcliff |
| Design | IV, DV, controls, counterbalancing, random assignment | Within vs between |
| Statistics | p-value is not the probability the hypothesis is true; report effect sizes, intervals, sample size | Power, preregistration |
| EEG, MEG | Millisecond timing, coarse place | Berger 1920s; Kutas and Hillyard 1980 |
| fMRI, PET | Fine place, slow time; correlational | BOLD peaks about 4-6 s |
| TMS, lesions | Causal evidence; double dissociation | Broca 1861; H.M. 1953 |
| Models | Symbolic, connectionist and Bayesian; judge by prediction, not fit alone | Soar, ACT-R, PDP 1986 |
Try it
Press Run (or Ctrl + Enter) to see the console output here.
No output.
Check your understanding
Quick check · 10 questions
of 10 answered You scored / 10 · perfect!
-
1. A distribution of reaction times is usually
Lapses and slow trials create a long right tail, which is why medians and distributions are used. -
2. The additive-factors method says that two variables with additive effects on RT
Additivity suggests separate stages; interaction suggests a shared stage. -
3. In a within-subjects design, counterbalancing is used to
Varying the order prevents fatigue or practice from being confounded with a condition. -
4. Which is the correct reading of p = 0.03?
The p-value is about the data under the assumption of no effect. -
5. Which pair is correctly matched?
TMS is a causal tool. fMRI is slow, EEG is spatially coarse, and PET uses a radioactive tracer. -
6. H.M.'s case is most associated with
After bilateral medial temporal lobe removal, H.M. could not form new long-term event memories. -
7. A double dissociation is evidence for
Opposite patterns of impairment suggest partly independent systems. -
8. Hick's law predicts that doubling the number of equally likely choices
RT depends on the logarithm of the number of alternatives. -
9. Which family of models treats beliefs as probabilities updated by evidence?
Bayesian models update a prior belief with the likelihood of the evidence. -
10. Why is fitting old data well not enough for a model?
Predicting new, held-out data is the strong test of a model.
Summary
- Time, design, brain and model methods each have strengths and blind spots, so converging evidence is the goal.
- Reaction times are skewed and accuracy must be read together with them.
- Good designs control confounds; good statistics report effect sizes and are planned in advance.
- Brain methods tell where and when; causal claims need disruption or lesion evidence.
- Models make theories testable; predicting new data is the key test.
Track your progress
Create a free account to tick off lessons and pick up where you left off on any device.
of Cognitive Psychology lessons completed