


















Lesson 9 of 50 · Methods and Cognitive Architecture
Cognitive Neuroscience Methods
Compare EEG, MEG, fMRI, PET, TMS and lesion studies, learn what each reveals about time and place in the brain, and why brain data need careful interpretation.
Behavior tells us what people do. To ask which brain systems support a mental process, and when they act, we need methods that touch the brain itself. Cognitive neuroscience combines the theories of cognitive psychology with such methods. No method is perfect: some see time well and space poorly, some the reverse, and some show only that a brain area is involved, not that it is necessary. This lesson maps the main tools.
What you will learn
- What EEG, MEG, fMRI, PET, TMS and lesion studies measure or do.
- The trade-off between time and space resolution.
- The difference between correlational and causal evidence.
- Why a "blob on a brain image" needs careful reading.
Key terms
EEG (electroencephalography): recording electrical activity from electrodes on the scalp.
ERP (event-related potential): the average EEG response time-locked to a stimulus.
fMRI (functional magnetic resonance imaging): measuring blood-oxygen-level changes (the BOLD signal) as a proxy for neural activity.
TMS (transcranial magnetic stimulation): using a brief magnetic pulse to temporarily disrupt activity in a small brain region.
Lesion: damage to a brain region, from injury, stroke, surgery or disease.
Dissociation: a pattern where one ability is impaired and another is spared.
Seeing time: EEG and MEG
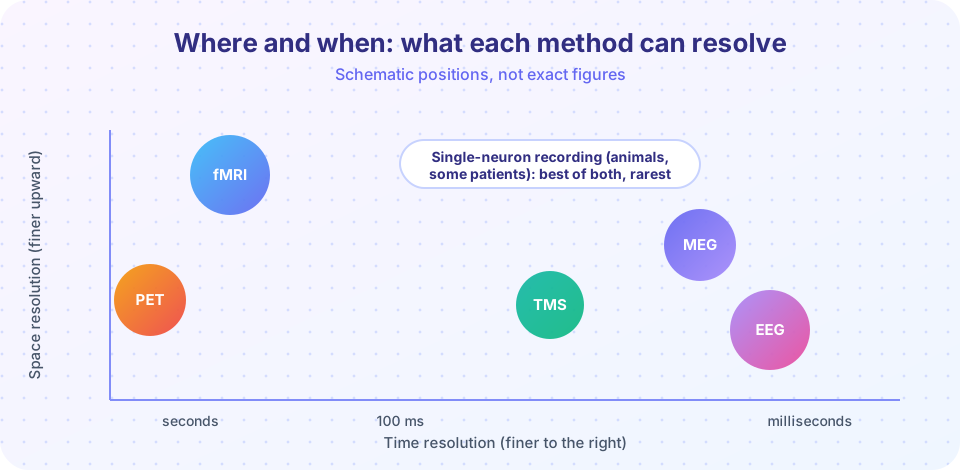
EEG was first recorded from the human scalp by the German psychiatrist Hans Berger in the 1920s. Electrodes on the scalp pick up tiny voltage changes produced by many neurons firing together. EEG has superb time resolution, in milliseconds, but poor spatial resolution, because the skull and scalp blur the signal and the same pattern can arise from many source arrangements.
A single trial is mostly noise, so researchers average many trials time-locked to a stimulus to get the ERP. Two famous components:
- P300: a positive deflection around 300 ms after a rare or surprising target, linked to updating of attention and expectations.
- N400: a negative deflection around 400 ms, larger for words that do not fit their context ("He spread the warm bread with socks"). Marta Kutas and Steven Hillyard reported it in 1980, and it has become a key tool for studying meaning.
MEG measures the tiny magnetic fields produced by the same neural currents. Magnetic fields pass through the skull with less distortion, so spatial estimates are somewhat better, but MEG machines need shielded rooms and are expensive.
Seeing place: fMRI and PET
fMRI uses a strong magnet to detect changes in blood oxygenation. When a region becomes more active, local blood flow rises by more than the oxygen used, and the BOLD signal changes. The signal builds over seconds, peaking roughly 4 to 6 seconds after the neural event, so fMRI has poor time resolution but good spatial resolution, on the order of millimeters. Since the 1990s it has been the leading tool for mapping cognitive functions.
PET (positron emission tomography) tracks a radioactive tracer injected into the blood. It can follow glucose use or specific neurotransmitters, but it involves radiation, so it is used less for routine studies.
What these methods show is that a region's activity changes during a task. They do not show that the region is needed.
Causal tools: TMS and lesions
TMS, developed in the 1980s (Anthony Barker and colleagues, 1985), uses a coil on the scalp to deliver a brief magnetic pulse that disrupts activity in a small cortical region for a short time. If a task gets worse when a region is disrupted, that region contributes causally. TMS is considered safe when used within established guidelines, but it only reaches regions near the surface, and the effects spread beyond the target. Weak electrical stimulation (tDCS) is also used, with more modest and debated effects.
Lesion studies examine people with brain damage. Famous cases:
- Phineas Gage, whose frontal lobes were damaged by an iron rod in 1848, reported to show changes in personality. Details of his case are debated; reports were sparse and sometimes exaggerated.
- "Tan" (Louis Victor Leborgne), studied by Paul Broca in 1861. He could understand speech but could say almost only one syllable. After his death, a left frontal lesion was found. This was foundational for the idea that language production depends on a specific region.
- Patient H.M. (Henry Molaison), whose medial temporal lobes were removed in 1953 to treat severe epilepsy. He could no longer form new long-term memories of events, though his short-term memory and some skills were preserved. The studies by Brenda Milner and others made him the most influential case in memory research (Chapter 5).
A powerful pattern is the double dissociation: patient A is impaired at task X but fine at task Y, while patient B shows the reverse. This supports the idea that the tasks rely on partly separate systems. It is strong evidence, but not perfect proof, because tasks differ in difficulty and damage is rarely tidy.
Single neurons
In animals, and rarely in human patients during surgery, electrodes can record from single neurons. This offers the best resolution of both time and place, but only for tiny populations. Hubel and Wiesel's recordings from cat visual cortex in the late 1950s and 1960s found neurons that respond to oriented edges, which won them the Nobel Prize in 1981 and shaped theories of visual feature detection (Chapter 4).
Reading brain data carefully
- Reverse inference. "Region X was active, and X is known for emotion, so the task involved emotion" is a risky inference, because most regions take part in many functions. The conclusion is only as good as the selectivity of the region.
- Multiple comparisons. An fMRI scan has tens of thousands of measurement points. Without statistical correction, some will look active by chance. A well-known 2009 demonstration by Craig Bennett and colleagues showed apparent "activity" in a dead salmon when no correction was used, to make this point.
- Small samples and flexibility. Brain studies are costly, which encourages small samples and many analysis choices. Larger samples, preregistration and data sharing have improved reliability.
- Individual differences. Averages across people hide variability.
- Pattern methods. Modern multivariate pattern analysis uses patterns across many voxels to decode what a person is seeing or thinking about, which can be more sensitive than looking for a single active blob.
Common misconceptions
"The brain lights up." Brain images are statistical maps of small signal changes, usually computed by subtraction between conditions and plotted in colors chosen by the researcher. The brain is always active.
"One brain area does one thing." Many functions rely on networks, and most regions contribute to several functions.
"Neuroscience explains the mind completely, so cognitive theories are optional." Brain data tell you where and when; you still need a cognitive theory to say what is computed.
Try it
Press Run (or Ctrl + Enter) to see the result here.
Program input · what you'd type while the program runs
Type the answers before you press Run, one per line. Each time the program reads a line (with input()), it gets the next line from this box.
Press Run (or Ctrl + Enter) to see the result here.
Program input · what you'd type while the program runs
Type the answers before you press Run, one per line. Each time the program reads a line (with input()), it gets the next line from this box.
Press Run (or Ctrl + Enter) to see the console output here.
No output.
Check your understanding
Quick check · 6 questions
of 6 answered You scored / 6 · perfect!
-
1. Which method has the best time resolution among non-invasive tools?
EEG (and MEG) resolve neural events in milliseconds, while fMRI follows a slow blood-flow response. -
2. Why do ERP researchers average over many trials?
Noise is random and averages toward zero, while the signal time-locked to the stimulus remains. -
3. A TMS pulse over a region makes people worse at a task. This suggests that the region
Temporarily disrupting a region and observing a deficit is evidence for a causal contribution. -
4. A double dissociation shows
Opposite patterns of impairment in two patients support partly independent systems. -
5. What was the point of the dead-salmon fMRI demonstration?
With thousands of measurement points, uncorrected statistics produce false positives. -
6. The BOLD signal in fMRI peaks roughly
The blood-flow response is slow, so fMRI has poor time resolution.
Summary
- EEG and MEG see time well (milliseconds); fMRI sees place well (millimeters) but slowly; PET is useful but less used for routine work.
- TMS and lesion studies test whether a region is necessary; imaging alone is correlational.
- Double dissociations are strong, though not perfect, evidence for separable systems.
- Reverse inference, multiple comparisons, small samples and flexible analysis are the main pitfalls.
- Brain data show where and when; cognitive theory is still needed to say what is computed.
Track your progress
Create a free account to tick off lessons and pick up where you left off on any device.
of Cognitive Psychology lessons completed