


















Lesson 43 of 47 · Projects and Practice
Project: Build a Screening Test Evaluator
Simulate a screening questionnaire, draw its ROC curve, compute AUC and Youden's J, pick a cutoff and see how PPV changes with prevalence.
When a clinic adopts a screening questionnaire, three questions come up. How well does the scale separate people who have the condition from those who do not? Where should the cutoff go? And how many of the people it flags will truly have the condition? In this project you will answer all three, using a simulated scale so that you know the truth about every "patient".
You will practice the ideas from the assessment lesson (sensitivity, specificity, base rates) in code, and learn to read a receiver operating characteristic (ROC) curve, one of the standard tools of diagnostic research.
Educational information only. The data in this project are simulated, and the scale is invented. The project teaches how to evaluate screening tools; it does not evaluate any real instrument.
What you will learn
- Simulate scores for people with and without a condition.
- Compute sensitivity and specificity at every cutoff.
- Draw an ROC curve and compute the area under it (AUC).
- Choose a cutoff using Youden's J and discuss other criteria.
- See how positive predictive value (PPV) depends on prevalence.
Key terms
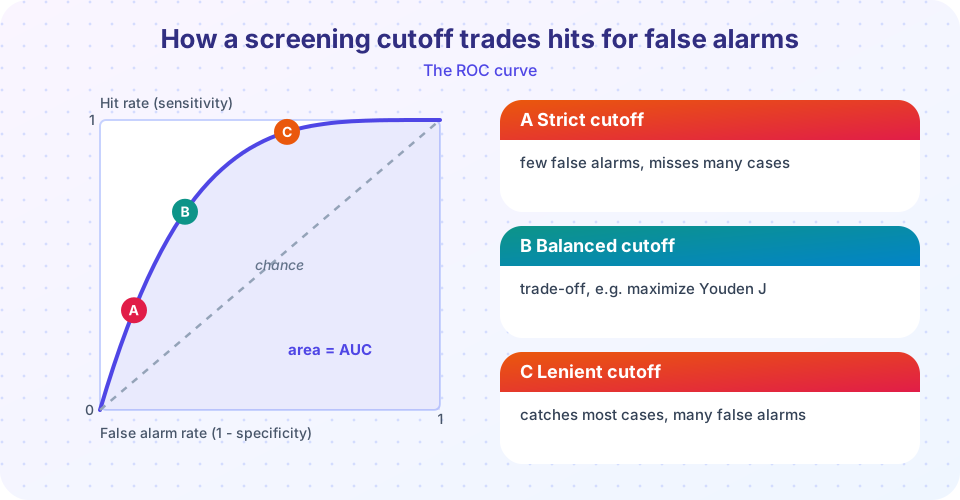
- ROC curve: a plot of sensitivity against 1 minus specificity for every possible cutoff.
- AUC: the area under the ROC curve; 0.5 is chance and 1.0 is perfect separation.
- Youden's J: sensitivity + specificity - 1; the cutoff with the largest J balances the two.
- Cutoff (threshold): the score at or above which a person is flagged.
- Spectrum bias: a test looks better when evaluated on clear-cut cases and clear-cut healthy people than on the messy middle.
Step 1: simulate a scale
We invent a scale scored 0 to 27 (like a nine-item, 0 to 3 questionnaire). People with the condition score higher on average than people without, but the groups overlap, as they do in real life. We create 500 cases and 4,500 non-cases, so the prevalence is 10 percent.
Step 2: sensitivity and specificity at each cutoff
For each possible cutoff c, flag everyone who scores c or more. Sensitivity is the share of cases flagged; specificity is the share of non-cases not flagged. As the cutoff rises, specificity improves and sensitivity falls.
Step 3: ROC curve and AUC
Plot sensitivity (the hit rate) against 1 - specificity (the false alarm rate) for all cutoffs. A useless scale falls on the diagonal, and a perfect one hugs the top-left corner. The AUC has a friendly interpretation: it is the probability that a randomly chosen case scores higher than a randomly chosen non-case.
Step 4: choose a cutoff
A common rule is the cutoff that maximizes Youden's J. But the best cutoff depends on the purpose. A first-stage screen that will be followed by a careful interview can use a lenient cutoff, because missing cases is costly and false alarms are cheaply sorted out. A tool that triggers an intensive or risky intervention needs a stricter one.
Step 5: prevalence and PPV
The same scale and cutoff have a different PPV in a primary care clinic (low prevalence) than in a specialist service (high prevalence). Always ask: in which population was the evidence collected, and in which will we use it?
Common misconceptions
"An AUC of 0.8 means the test is right 80 percent of the time." It is the chance that a random case outscores a random non-case, which is not the same as accuracy at a cutoff.
"One best cutoff exists." The best cutoff depends on prevalence, costs of errors and the purpose.
"A good scale is good for everyone." Scales can work differently across languages, ages and cultures, so they must be checked in each group.
Try it
Run the simulation, then change the means, standard deviations and group sizes and see how the ROC curve and AUC change. The second program shows how PPV depends on prevalence for several cutoffs.
Press Run (or Ctrl + Enter) to see the result here.
Program input · what you'd type while the program runs
Type the answers before you press Run, one per line. Each time the program reads a line (with input()), it gets the next line from this box.
Press Run (or Ctrl + Enter) to see the result here.
Program input · what you'd type while the program runs
Type the answers before you press Run, one per line. Each time the program reads a line (with input()), it gets the next line from this box.
Extension ideas
- Change the case mean from 14 to 11 and watch the AUC fall. How much overlap is too much?
- Add a second group (for example, a different language group) whose non-cases score 2 points higher on average. What happens to the false alarm rate at the same cutoff? This is a simple illustration of why fairness checks matter.
- Report your evaluation using the headings of the STARD guideline for diagnostic accuracy studies: participants, test methods, reference standard, results and limitations.
Check your understanding
Quick check · 4 questions
of 4 answered You scored / 4 · perfect!
-
1. What does an AUC of 0.5 indicate?
An AUC of 0.5 corresponds to the diagonal of the ROC plot: a score no better than flipping a coin. -
2. As the cutoff rises, what usually happens?
A stricter cutoff flags fewer people, so it misses more cases but gives fewer false alarms. -
3. What does Youden's J equal?
The cutoff with the largest J balances hits against false alarms. -
4. Why can the same scale have a different PPV in two clinics?
PPV depends on how common the condition is in the group screened.
Summary
- Simulating data lets you see exactly how sensitivity, specificity, ROC curves and AUC work.
- The best cutoff depends on purpose, costs of errors and prevalence, not only on a formula.
- PPV changes with prevalence, so evidence must match the population where a tool is used.
- Evaluate tools across groups to check fairness, and report results clearly.
Track your progress
Create a free account to tick off lessons and pick up where you left off on any device.
of Abnormal and Clinical Psychology lessons completed