


















Lesson 34 of 45 · Optoelectronic Devices
Photodiodes and solar cells
Learn how photodiodes and solar cells turn light into current: absorption, responsivity, the illuminated diode equation, fill factor, resistances and the efficiency limit.
Run an LED backwards and it becomes a detector. Light with photon energy above the band gap creates electron-hole pairs; the electric field of a pn junction pulls the two kinds of carrier apart; the result is a current that is proportional to the light power. Use that current to sense light and you have a photodiode; use it to deliver power and you have a solar cell. The two share the same physics but are designed and biased differently.
What you will learn
- How light is absorbed in a semiconductor and why wavelength limits what a device can detect.
- How to compute photodiode responsivity and the shot-noise limit.
- The illuminated diode equation and the shape of the solar cell I-V curve.
- What V_oc, I_sc, fill factor and efficiency mean, and how series and shunt resistance degrade a cell.
- Where the efficiency limit comes from.
Key terms
Quantum efficiency (η): the number of collected electron-hole pairs per incident photon.
Responsivity (R): photocurrent per watt of light, R = η q λ / (h c).
Photocurrent (I_L or I_ph): the current generated by absorbed light.
Open-circuit voltage (V_oc) and short-circuit current (I_sc): the two ends of the solar cell I-V curve.
Fill factor (FF): P_max / (I_sc V_oc), a measure of how "square" the curve is.
Absorption and collection
A photon is absorbed only if its energy exceeds the band gap, which means the wavelength must be shorter than the cutoff λ_c = 1239.8 / E_g. For silicon (E_g = 1.12 eV) this is about 1100 nm. Longer wavelengths pass through. The light intensity falls off with depth as I(x) = I₀ e^(−αx), where the absorption coefficient α depends strongly on wavelength and material. Silicon absorbs blue light within a micrometer, while near-infrared light (850 nm, where α is of the order of 10² to 10³ cm⁻¹) travels tens of micrometers. Indirect-gap silicon needs thicker layers than direct-gap GaAs or InGaAs to absorb the same light.
The generated pairs must be collected before they recombine. In the depletion region, the built-in and applied field sweeps electrons one way and holes the other in a time shorter than the carrier lifetime. Pairs generated within a diffusion length of the depletion edge can also diffuse to it and be collected. Pairs created farther away are lost. Different devices maximize collection in different ways.
Photodiodes
A photodiode is operated in one of two modes.
- Photovoltaic mode (zero bias): lowest noise (no dark current); used for precision measurements.
- Photoconductive mode (reverse bias): the reverse voltage widens the depletion region, which reduces capacitance (faster response), increases the collection volume and linearity; at the cost of a small dark current.
PIN photodiodes place a wide, undoped (intrinsic) layer between p and n regions so that most absorption takes place in a strong-field region. Avalanche photodiodes (APDs) run near breakdown so that each photo-generated carrier triggers an avalanche of impact ionization, giving internal gain (10 to several hundred) at the price of extra noise.
Responsivity
The photocurrent is I_ph = η q Φ, where Φ is the photon flux, and each photon carries energy hc/λ. For optical power P:
R = I_ph / P = η q λ / (h c) = η λ[µm] / 1.2398 (in A/W)
Example. At 850 nm with η = 0.8: R = 0.8 × 0.85 / 1.24 = 0.548 A/W. A light power of 10 µW gives I_ph = 5.48 µA, and a 10 kΩ load turns it into 55 mV.
The noise floor
Even a perfect detector has shot noise from the discrete nature of charge: i_n = √(2 q I Δf). For I = 5.48 µA and a bandwidth Δf = 1 MHz, i_n = √(2 × 1.602e-19 × 5.48e-6 × 1e6) = 1.3 nA, so the signal-to-noise ratio of the current is 5.48 µA / 1.3 nA ≈ 4,100 (about 72 dB). Thermal noise from the load resistor often dominates for small signals, which is why a transimpedance amplifier follows the diode.
Solar cells
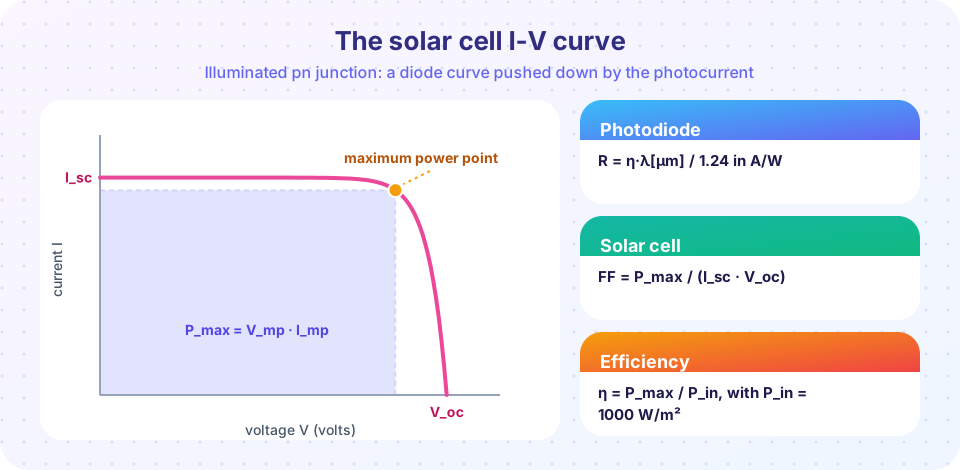
An illuminated solar cell is a diode in parallel with a current source I_L. Its terminal current is
I = I_L − I_0 ( e^(V / (n V_T)) − 1 )
where I_0 is the dark saturation current and n the ideality factor. The two ends of the curve are:
- Short circuit (V = 0):
I_sc = I_L. - Open circuit (I = 0):
V_oc = n V_T ln(I_L / I_0 + 1).
V_oc depends only logarithmically on the light intensity but drops with temperature (for silicon about −2 mV/K, so power falls about 0.3 to 0.4% per kelvin).
The cell delivers power P = V I between those ends and the maximum is P_max = V_mp I_mp. The fill factor and efficiency are
FF = P_max / (I_sc V_oc) and η = P_max / P_in
with P_in = 1000 W/m² under the standard test condition (AM1.5G spectrum, 25 °C). Example: a 1 cm² silicon cell with J_sc = 40 mA/cm², V_oc = 0.70 V and FF = 0.82 gives P_max = 40 × 0.70 × 0.82 = 23.0 mW, so η = 23.0/100 = 23%.
Resistances
Real cells include a series resistance R_s (contacts, bulk, wiring) and a shunt resistance R_sh (leakage paths). The extended model is
I = I_L − I_0 (e^((V + I R_s)/(n V_T)) − 1) − (V + I R_s)/R_sh
A large R_s makes the curve slope near the open-circuit point and reduces FF; a small R_sh bends the flat part of the curve downward and lowers both FF and V_oc. These two parameters are fitted when engineers analyze measured cells; we build this model in the project lesson later.
The efficiency limit
Photons with energy below the gap are not absorbed; photons far above the gap lose the excess as heat when the electron relaxes to the band edge; and the cell must also radiate according to detailed balance. Together these processes cap the efficiency of a single-junction cell. A small gap wastes voltage; a large gap wastes photons. In the Shockley-Queisser analysis (1961) the optimum band gap is about 1.1 to 1.4 eV, and for the standard AM1.5G spectrum the maximum efficiency is about 33% at roughly 1.34 eV. Silicon's limit is a little below 30%, and the best silicon solar cells have passed 26% in practice. Multi-junction cells stacking different gaps overcome this limit and are used where cost matters less, such as in space.
Common misconceptions
"A solar cell stores energy." It converts light to electrical power on demand; it stores nothing. Batteries do the storing.
"Efficiency is highest at short circuit or open circuit." At both extremes the power is zero. The cell must operate near the maximum power point, which a charge controller tracks.
"Photodiodes and solar cells are different physics." The structure is similar; the difference is design (area, doping, bias, antireflection) and load.
Try it
First, simulate an illuminated cell with and without series resistance. The script solves the implicit equation for the current at each voltage and reports V_oc, I_sc, FF and efficiency.
Press Run (or Ctrl + Enter) to see the result here.
Program input · what you'd type while the program runs
Type the answers before you press Run, one per line. Each time the program reads a line (with input()), it gets the next line from this box.
Second, a simplified detailed-balance calculation of the single-junction efficiency limit as a function of band gap. It uses a 5778 K black-body "Sun" and a cell at 300 K, so the numbers differ a little from the AM1.5G value quoted above; the shape (a peak near 1.1 to 1.4 eV) is the point.
Press Run (or Ctrl + Enter) to see the result here.
Program input · what you'd type while the program runs
Type the answers before you press Run, one per line. Each time the program reads a line (with input()), it gets the next line from this box.
Check your understanding
Quick check · 5 questions
of 5 answered You scored / 5 · perfect!
-
1. What is the responsivity (in A/W) of a photodiode with η = 0.9 at λ = 1000 nm?
R = ηλ[µm]/1.24 = 0.9 × 1.0 / 1.24 = 0.726 A/W. -
2. Silicon (E_g = 1.12 eV) cannot detect light of wavelength
The cutoff is 1240/1.12 = 1107 nm, so 1300 nm photons lack the energy to cross the gap. -
3. A solar cell has J_sc = 35 mA/cm², V_oc = 0.65 V and FF = 0.80 under 100 mW/cm². Its efficiency is
P_max = 35 × 0.65 × 0.80 = 18.2 mW/cm², so the efficiency is 18.2%. -
4. Increasing the series resistance of a solar cell mainly
R_s drops voltage at high current and rounds off the curve near the maximum power point. -
5. Photoconductive (reverse-bias) operation of a photodiode gives
Reverse bias widens the depletion layer, reducing capacitance and improving speed, at the cost of dark current.
Summary
- Photons with
E ≥ E_gcreate electron-hole pairs; the junction field collects them as photocurrent. - Responsivity
R = ηλ[µm]/1.24A/W; shot noise sets the detection floori_n = √(2qIΔf). - Solar cell:
I = I_L − I_0(e^(V/nV_T) − 1);V_oc = nV_T ln(I_L/I_0 + 1);FF = P_max/(I_scV_oc);η = P_max/P_in. - Series resistance and shunt leakage lower the fill factor.
- A single junction is limited to roughly one third efficiency for the solar spectrum, with the best gap near 1.1 to 1.4 eV.
Next: Chapter review
Track your progress
Create a free account to tick off lessons and pick up where you left off on any device.
of Semiconductor Devices lessons completed