


















Lesson 28 of 45 · MOS Capacitors and MOSFETs
The MOS capacitor: accumulation, depletion, inversion
Understand the MOS capacitor on p-type silicon: three states, band bending, depletion width, threshold voltage with a worked 10 nm oxide example and the C-V curve.
Before a MOSFET can switch, its gate has to change what is happening inside the silicon. The place where that happens is the MOS capacitor: a gate electrode, an oxide, and a silicon body. Understanding it tells you where the threshold voltage comes from, why the oxide must be so thin, and why capacitance measurements are the standard way to examine a chip process. We use a p-type body (the substrate of an n-channel MOSFET) throughout.
What you will learn
- The three states of the MOS capacitor and how the bands bend in each.
- The meaning of the Fermi potential φ_F, the maximum depletion width and the threshold voltage.
- How to compute V_T from doping, oxide thickness and the work-function difference.
- How the capacitance-voltage (C-V) curve reveals the three states.
- Why the gate oxide is the most carefully controlled layer in a chip.
Key terms
Flat-band voltage (V_FB): the gate voltage at which the bands are flat and there is no net charge in the silicon.
Fermi potential (φ_F): the distance between the intrinsic and the Fermi level, in volts: φ_F = V_T ln(N_A / n_i) for p-type (here V_T is the thermal voltage).
Surface potential (ψ_s): how far the bands have bent at the surface.
Depletion width (W): the depth of the region emptied of mobile holes.
Oxide capacitance (C_ox): ε_ox / t_ox, per unit area.
Three states of a p-type MOS capacitor
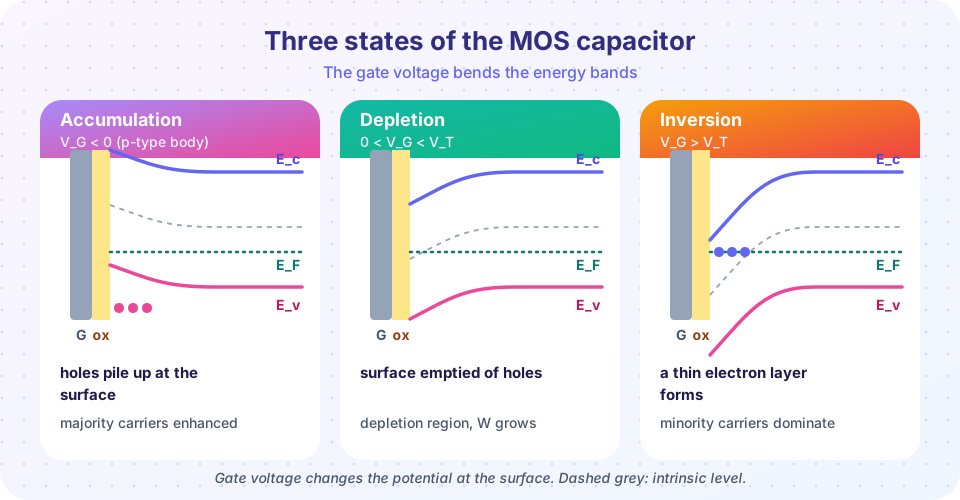
Accumulation (V_G < V_FB). A negative gate attracts holes (the majority carrier) to the surface. The bands bend upward; the valence band approaches the Fermi level and the hole density at the surface exceeds the bulk. The silicon behaves like a conductor plate, and the total capacitance equals the oxide capacitance C_ox.
Depletion (V_FB < V_G < V_T). A positive gate repels holes and leaves behind fixed, negatively charged ionized acceptors. A depletion region of width W forms. The bands bend downward. The silicon now acts like a second capacitor in series, so the total capacitance falls as W grows.
Inversion (V_G > V_T). The bands bend down so far that the intrinsic level at the surface passes below the Fermi level. At that point the surface is "more n-type than the bulk is p-type" and mobile electrons gather there. The onset of strong inversion is defined as ψ_s = 2φ_F, when the electron density at the surface equals the hole density in the bulk. Further gate voltage is absorbed by more electrons, not by a wider depletion region, so the depletion width reaches a maximum.
The key formulas
For p-type silicon with acceptor density N_A:
φ_F = V_T · ln(N_A / n_i)
The maximum depletion width at strong inversion follows from solving Poisson's equation with the depletion approximation:
W_max = √( 2 ε_Si · (2 φ_F) / (q N_A) )
and the depletion charge per unit area is Q_dep = q N_A W_max. The threshold voltage collects three contributions: the work-function mismatch and charges that set the flat-band condition, the surface potential 2φ_F needed to invert, and the voltage across the oxide that supports the depletion charge:
V_T = V_FB + 2 φ_F + Q_dep / C_ox
A worked example
Take N_A = 10¹⁷ cm⁻³, n_i = 10¹⁰ cm⁻³, T = 300 K (V_T = 25.85 mV), a 10 nm oxide, and an n+ polysilicon gate with V_FB ≈ −0.98 V (the approximate work-function difference for n+ poly on p-type silicon, with no oxide charge). Use ε_Si = 11.7 ε₀ and ε_ox = 3.9 ε₀, with ε₀ = 8.854×10⁻¹⁴ F/cm.
φ_F = 0.02585 × ln(10⁷) = 0.417 V, so 2φ_F = 0.833 V.W_max = √(2 × 1.036e-12 × 0.833 / (1.602e-19 × 1e17)) = 1.04e-5 cm = 0.104 µm.C_ox = 3.9 × 8.854e-14 / 1e-6 = 3.45e-7 F/cm² = 0.345 µF/cm².Q_dep = 1.602e-19 × 1e17 × 1.04e-5 = 1.66e-7 C/cm², soQ_dep / C_ox = 0.48 V.V_T = −0.98 + 0.83 + 0.48 ≈ 0.34 V.
You can see the levers. A thinner oxide (larger C_ox) reduces the third term; more doping increases both 2φ_F and Q_dep. Engineers set the threshold with an ion implant in the channel region, which is much easier than changing the substrate.
The C-V curve
Measure the small-signal capacitance of the MOS structure while sweeping the gate voltage and the three states appear as three regions.
- In accumulation, C = C_ox.
- In depletion, the oxide capacitance is in series with the depletion capacitance
C_dep = ε_Si / W, soC = C_ox C_dep / (C_ox + C_dep), decreasing as W grows. - In inversion at low frequency, minority carriers can follow the signal and C returns to C_ox. At high frequency (above about 1 kHz to 1 MHz, depending on generation rate) the electrons cannot follow, so C stays at its minimum,
C_min = ε_ox / (t_ox + (ε_ox/ε_Si) W_max).
For our example, C_min = 1 / (1/3.45e-7 + 1.04e-5/1.036e-12), which is 0.077 µF/cm², about 22% of C_ox. The depth of the C-V dip reports on the doping, and its horizontal position reports on V_FB and oxide charge, so process engineers use C-V curves as a routine check.
Common misconceptions
"Inversion means the depletion layer disappears." The opposite: the depletion region is at its widest. After strong inversion the extra gate charge is balanced by electrons.
"A positive gate voltage injects electrons from the gate." The oxide blocks DC current. Electrons come from thermal generation in the body (in a MOSFET, from the source), not from the gate.
"Oxide thickness is an arbitrary design choice." It trades gate control (thin is better) against leakage by quantum tunneling (thin is worse). Below roughly 1.5 to 2 nm of SiO₂, tunneling leakage forced the industry to adopt high-k dielectrics.
Try it
This cell calculates the fundamental quantities for any doping and oxide thickness, then plots the high-frequency C-V curve with a simple surface-potential model. The curve is a teaching model built from the depletion approximation.
Press Run (or Ctrl + Enter) to see the result here.
Program input · what you'd type while the program runs
Type the answers before you press Run, one per line. Each time the program reads a line (with input()), it gets the next line from this box.
The widget below is an interactive threshold calculator. Move the sliders and see how oxide thickness and doping change the threshold; it applies the same equations as the cell above.
Check your understanding
Quick check · 5 questions
of 5 answered You scored / 5 · perfect!
-
1. On p-type silicon, which gate voltage produces accumulation?
A negative gate attracts holes, the majority carriers, to the surface. -
2. For N_A = 10¹⁶ cm⁻³ and n_i = 10¹⁰ cm⁻³ at 300 K, φ_F is about
φ_F = 0.02585 × ln(10⁶) = 0.02585 × 13.82 = 0.357 V. -
3. Strong inversion begins when the surface potential equals
At ψ_s = 2φ_F the surface electron density equals the bulk hole density. -
4. What happens to the maximum depletion width when N_A increases?
W_max ∝ √(φ_F/N_A) roughly, so more doping gives a narrower depletion region. -
5. The high-frequency C-V curve stays at its minimum in inversion because
Generation of minority carriers is slow, so the inversion layer cannot respond at high frequency and the capacitance remains C_min.
Summary
- The MOS capacitor passes from accumulation to depletion to inversion as the gate voltage rises (p-type body).
- Strong inversion starts at ψ_s = 2φ_F; the depletion width then stops growing at W_max.
V_T = V_FB + 2φ_F + Q_dep/C_ox; the worked example (10¹⁷ cm⁻³, 10 nm oxide) gives about 0.34 V.- The C-V curve shows C_ox in accumulation, a dip in depletion, and either a return to C_ox (low frequency) or C_min (high frequency) in inversion.
Next: MOSFET operation
Track your progress
Create a free account to tick off lessons and pick up where you left off on any device.
of Semiconductor Devices lessons completed