


















Lesson 39 of 46 · Health Systems and Policy
Health Policy and Evaluation
How public health policies are made and judged: the policy cycle, evidence use, interrupted time series, natural experiments, QALYs and ICERs, with tobacco, seat belts and lead as cases.
Knowing that something harms health is not the same as changing it. Most of the large gains in population health over the last century came from decisions made by governments, regulators and communities: clean water laws, tobacco taxes, seat-belt rules, vaccination programs and the removal of lead from petrol. A policy changes the circumstances for millions of people at once, so we want to know whether it works, what it costs, who benefits and what unintended effects it brings.
This lesson explains how policy is made (and why evidence is only one input), how epidemiologists evaluate policies when randomized trials are impossible, and how economists compare interventions with measures such as the QALY and the ICER.
What you will learn
- Describe the policy cycle and the role of evidence and values.
- Explain how natural experiments and interrupted time series evaluate policies.
- Compute and interpret a cost-effectiveness ratio (ICER) using QALYs.
- Summarize several landmark policies and what they teach.
- Discuss the ethical trade-offs of population-level interventions.
Key terms
Policy cycle: a simplified model of policy as stages from problem identification to evaluation.
Natural experiment: a situation in which an exposure (such as a new law) is assigned by events outside researchers' control, in a way that resembles randomization.
Interrupted time series (ITS): a design that compares the level and trend of an outcome before and after an intervention.
QALY: quality-adjusted life year, one year in perfect health.
ICER: incremental cost-effectiveness ratio, the extra cost per extra unit of health gained.
How policy is made
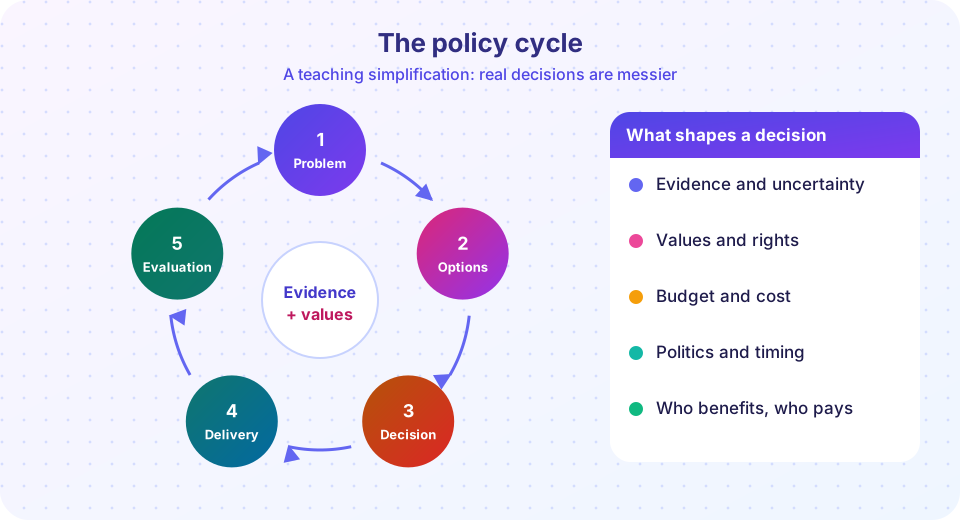
A common simplification is the policy cycle:
- Problem identification and agenda setting. Which issues get attention? Surveillance data, research, media, advocacy and sudden events all matter.
- Policy formulation. What options exist? Evidence is reviewed, stakeholders consulted and cost and feasibility examined.
- Decision. Politicians and officials choose, weighing evidence, values, budgets, public opinion and the interests of affected groups.
- Implementation. Agencies, providers and the public put the policy into practice; enforcement, funding and local conditions determine what really happens.
- Evaluation. Did it work, for whom, at what cost, with what side effects? The answer may restart the cycle.
Real policy making is messier than a neat cycle. Scholars such as John Kingdon described how a policy "window" opens when a problem, an available solution and political will come together. Epidemiologists contribute best when they translate evidence into clear options, state uncertainty honestly, and understand that evidence informs decisions but values make them: how much liberty to restrict, how to balance costs for some people against benefits for others, and whom to prioritize.
Evaluating a policy without a trial
Randomizing a national law is usually impossible. Public health has several alternatives:
- Before-and-after comparison. Simple but vulnerable to trends and events that happened at the same time.
- Controlled before-and-after / difference-in-differences. Compare change in a place with the policy to change in a similar place without it. This removes trends shared by both, under an assumption of parallel trends.
- Interrupted time series. Use many time points before and after the policy. A segmented regression estimates the pre-policy trend, a level change at the start and a trend change afterwards. Because it uses the previous trend as the comparison, it handles slow underlying changes, but it cannot rule out another event that happened at the same time, and it needs enough data points (often 12 or more before and after).
- Natural experiments. For example, differences in when different states or countries introduced a rule, or a policy that applies only above a cut-off (regression discontinuity).
- Process evaluation. Was the policy implemented as planned? A policy that was never enforced cannot be judged a failure of the idea.
The ideas of Chapter 5 apply here: confounding, bias and chance threaten every method, and the best conclusions come from several designs that agree.
Cost-effectiveness: QALYs and ICERs
Resources are limited, so decision makers ask which interventions give the most health for the money. Cost-effectiveness analysis compares two options, a new intervention and the current alternative.
A QALY combines length and quality of life: a year in perfect health is 1 QALY; a year at a health state valued at 0.7 is 0.7 QALY; death is 0. QALYs gained = difference in QALYs lived with and without the intervention (with discounting of future values in most analyses).
ICER = (Cost_new - Cost_old) / (QALYs_new - QALYs_old)
Example: a new program costs 5,000 more per person than the current care and yields 0.25 more QALYs per person. ICER = 5,000 / 0.25 = 20,000 per QALY gained. The decision then compares the ICER with a threshold that reflects what the health system or society is willing to pay. Some agencies use ranges of roughly 20,000 to 30,000 pounds per QALY (NICE in England), and others use multiples of national income; every threshold is debated, and decisions also consider equity, severity of disease and budget impact. An intervention that costs less and gives more health is "dominant"; one that costs more and gives less health is dominated. Plotting differences in cost and effect on the cost-effectiveness plane shows these cases.
Critics point out that QALYs rest on value judgments about how to measure quality of life and treat all QALYs as equal regardless of who gains them, which can disadvantage people with disabilities and older people. Many analyses therefore report distributional effects alongside the average.
Case studies
Tobacco control. After the Doll and Hill evidence and the 1964 US Surgeon General's report, countries adopted combinations of measures. The WHO Framework Convention on Tobacco Control, adopted in 2003 and in force from 2005, committed parties to taxes, smoke-free places, advertising restrictions, warnings and cessation help. Evidence from many countries shows that higher tobacco taxes reduce consumption, and smoke-free laws are associated in several studies with reductions in hospital admissions for heart attacks. Tobacco control also shows how powerful industry opposition can slow policy.
Seat belts and road safety. The state of Victoria, Australia, made seat-belt use compulsory in 1970, and other jurisdictions followed. Occupant deaths fell where laws were enforced. Combined with drink-driving rules, speed limits, helmets and vehicle standards, they illustrate the Haddon matrix approach: injury prevention by changing people, vehicles and environments before, during and after a crash.
Lead in petrol. Leaded petrol exposed whole populations to lead, which harms children's brain development. As countries phased it out, average blood-lead levels in children fell sharply. In 2021 the United Nations Environment Programme announced that leaded petrol had been eliminated worldwide. It is a clear example of an upstream, population-wide measure.
Sugary drink taxes. Mexico introduced a tax of about one peso per liter on sugar-sweetened beverages in 2014. Studies found that purchases of taxed drinks fell by a few percent in the first year, with larger falls in lower-income households, though long-term effects on weight and disease are harder to measure. Many other countries followed with different designs. It shows how policy evaluation often yields evidence on intermediate outcomes (purchases) before health outcomes.
Ethics and limits
Population policies involve trade-offs. Arguments in favor point to the collective benefit and to the fact that individuals' choices are shaped by environments. Arguments against stress personal liberty and the risk of paternalism, or burdens falling on particular groups (taxes on tobacco or sugar can be regressive in money terms, even if the health gains are progressive). The harm principle of John Stuart Mill allows restricting liberty to prevent harm to others, which fits clean air laws better than bans on purely personal risks. The Nuffield ladder from the previous lesson helps: choose the least intrusive intervention that is likely to be effective, and be open about the evidence and reasoning.
Common misconceptions
"If the evidence is clear, policy follows automatically." Politics, cost, values and interests intervene.
"A policy has failed if outcomes did not change." It might not have been implemented, the effect might take years, or other forces might have hidden it.
"A low ICER means an intervention should always be funded." Budget, equity, severity and uncertainty also matter.
"Cost-effectiveness is the same as cost-saving." Many worthwhile interventions cost money; they are good value, not free.
Try it
First, an interrupted time series simulation. A policy begins at month 24. The code simulates a monthly rate with a pre-existing downward trend and a drop at the policy start, then fits a segmented regression to recover the level change.
Press Run (or Ctrl + Enter) to see the result here.
Program input · what you'd type while the program runs
Type the answers before you press Run, one per line. Each time the program reads a line (with input()), it gets the next line from this box.
Second, an ICER calculator with a decision rule. Enter the extra cost and extra QALYs and a threshold; the tool classifies the result. It is a teaching calculator, not a health technology assessment.
Check your understanding
Quick check · 5 questions
of 5 answered You scored / 5 · perfect!
-
1. An intervention costs 6,000 more per person and gains 0.3 QALYs per person. What is the ICER?
ICER = 6,000 / 0.3 = 20,000 per QALY gained. -
2. What does an interrupted time series estimate?
Segmented regression estimates level and slope changes at the intervention point. -
3. Which is a limitation of an interrupted time series?
ITS handles slow trends but cannot rule out simultaneous events. -
4. Which case study is an example of an upstream, population-wide measure that removed an exposure?
Removing lead from fuel reduced exposure for entire populations. -
5. Which is true of the policy cycle?
The cycle is a teaching simplification.
Summary
- Policy making involves evidence, values, politics and feasibility; the policy cycle is a useful simplification.
- Policies can be evaluated with natural experiments, difference-in-differences and interrupted time series, with attention to confounding.
- ICER = extra cost / extra QALYs, compared with a threshold and with equity and budget considerations.
- Landmark cases (tobacco, seat belts, lead, sugary drink taxes) show how population measures work and how they are contested.
Track your progress
Create a free account to tick off lessons and pick up where you left off on any device.
of Public Health and Epidemiology lessons completed