


















Lesson 34 of 46 · Chronic Disease and Prevention
Screening and Diagnostic Tests
Understand sensitivity, specificity and predictive values with natural frequencies, why positive results are often false in rare diseases, ROC curves and the biases of screening.
A test result seems like a verdict: positive or negative. Epidemiology teaches you to treat it as evidence that changes probabilities, but does not settle them. The most surprising lesson in this chapter is that a very accurate test can still give mostly false alarms when the disease is rare. Doctors, patients and policy makers misjudge this surprisingly often, and when it happens people can be harmed by needless worry, further tests and treatments.
Screening means testing people with no symptoms to find disease early, so that treatment can be started sooner. It differs from diagnostic testing, which is done in people who already have symptoms or a positive screen. Screening is offered to many healthy people, so its harms matter as much as its benefits.
What you will learn
- Define sensitivity, specificity, PPV and NPV and compute them from a 2x2 table.
- Explain why predictive values depend on prevalence.
- Describe how a test threshold trades sensitivity against specificity (ROC curve).
- List the criteria for a good screening program.
- Recognize lead-time, length-time and overdiagnosis biases.
Key terms
Sensitivity: the proportion of people with the disease who test positive.
Specificity: the proportion of people without the disease who test negative.
Positive predictive value (PPV): the proportion of positive tests that are true positives.
Negative predictive value (NPV): the proportion of negative tests that are true negatives.
Overdiagnosis: detecting disease that would never have caused symptoms or death during the person's life.
The 2x2 table
Every test result can be compared with the truth (a "gold standard"). That gives four groups.
| Disease present | Disease absent | |
|---|---|---|
| Test positive | True positive (TP) | False positive (FP) |
| Test negative | False negative (FN) | True negative (TN) |
Sensitivity = TP / (TP + FN)       the test's ability to find disease
Specificity = TN / (TN + FP)       the test's ability to clear the healthy
PPV         = TP / (TP + FP)       probability of disease given a positive test
NPV         = TN / (TN + FN)       probability of no disease given a negative test
Sensitivity and specificity describe the test; PPV and NPV describe what a result means for a patient in a particular population.
Natural frequencies: the base-rate puzzle
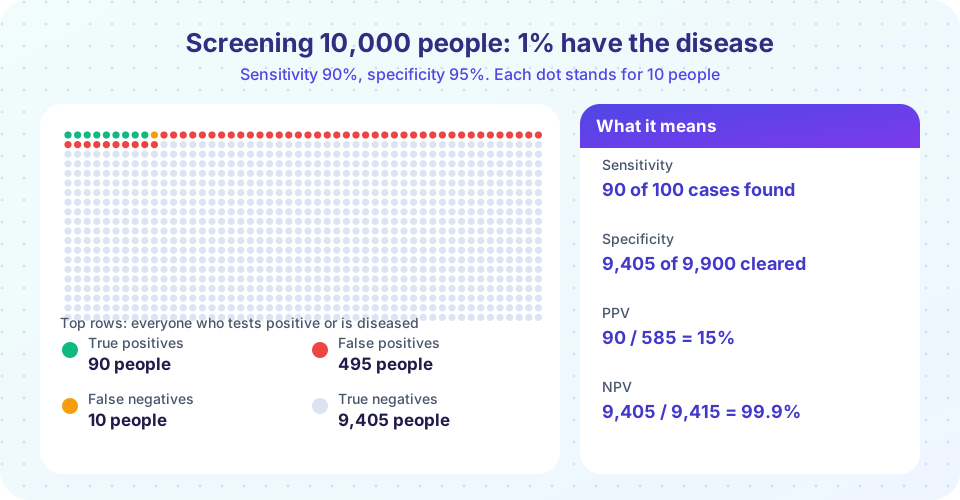
Take 10,000 people screened for a disease with 1% prevalence. The test has 90% sensitivity and 95% specificity.
- 100 people have the disease; 9,900 do not.
- Sensitivity 90%: 90 of the 100 are detected (TP = 90); 10 are missed (FN = 10).
- Specificity 95%: of the 9,900 healthy people, 9,405 test negative (TN) and 495 test positive (FP).
- Total positives = 90 + 495 = 585.
PPV = 90 / 585 = 15%. Only about 1 in 7 positive results is a true case. NPV = 9,405 / 9,415 = 99.9%; a negative result is very reassuring.
Now raise the prevalence to 20% (as in a group of high-risk patients with symptoms): 2,000 diseased, 8,000 healthy. TP = 1,800, FN = 200, TN = 7,600, FP = 400. PPV = 1,800 / 2,200 = 82%. The test is the same, but the meaning of a positive result is very different. The researcher Gerd Gigerenzer has shown that doctors understand these problems much better when numbers are presented as natural frequencies (counts of people) instead of probabilities and percentages, which is why this lesson uses them.
The same logic is Bayes' theorem. The pre-test probability (prevalence, or the clinician's estimate) combines with the test's likelihood ratio (LR+ = sensitivity / (1 - specificity)) to give the post-test probability. Here LR+ = 0.9 / 0.05 = 18: a positive result multiplies the odds of disease by 18. Starting with odds of 1 to 99, the post-test odds are 18 to 99, which is a probability of 15%. See /bayesian-statistics for more on updating beliefs.
Thresholds and ROC curves
Many tests give a continuous result (blood sugar, PSA level, a risk score). Someone must choose a cut-off. Moving the cut-off changes both sensitivity and specificity in opposite directions:
- A low threshold catches nearly all cases (high sensitivity) but flags many healthy people (low specificity).
- A high threshold has few false alarms but misses more cases.
The receiver operating characteristic (ROC) curve plots sensitivity against 1 - specificity as the cut-off varies. A useless test lies on the diagonal; a better test bows toward the top-left. The area under the curve (AUC) summarizes performance: 0.5 is chance, 1.0 is perfect.
The choice of cut-off depends on the consequences. For a cheap, harmless follow-up test and a dangerous disease you may accept many false positives. If a positive result leads to invasive surgery, specificity matters more.
What makes a good screening program?
In 1968 James Wilson and Gunnar Jungner wrote a WHO report setting out principles for screening that remain influential. In paraphrase:
- The condition is an important health problem with a recognizable early stage.
- There is an accepted treatment, and earlier treatment improves outcomes compared with treatment later.
- A suitable test exists that is acceptable to the public and has known performance.
- The natural history is understood, facilities for diagnosis and treatment are available, and the whole program's cost is balanced against its benefit.
- Screening is a continuing process, not a "once and for all" project.
The harms of screening include false positives (anxiety, extra tests, biopsies), false reassurance from false negatives, overdiagnosis and overtreatment, and radiation or other risks of the test itself.
Biases in evaluating screening
Studies of screening are especially prone to bias, and the correct outcome is usually disease-specific or overall mortality in a randomized trial, not survival after diagnosis.
- Lead-time bias. Screening finds disease earlier. If the date of death stays the same, survival measured from diagnosis gets longer, so screening looks beneficial. Example: cancer diagnosed at 60 by screening and death at 65 gives 5-year survival; diagnosed at 63 by symptoms and death at 65 gives 2 years. Nothing changed except the time of diagnosis.
- Length-time bias. Screening tends to detect slow-growing, less aggressive diseases because they spend longer in the detectable pre-symptomatic phase. Screen-detected cases therefore have better outcomes on average even if screening does nothing.
- Overdiagnosis. Some detected lesions would never have caused harm; treating them gives risks but no benefit. It is difficult to measure for an individual and is estimated from population trends and randomized trials.
- Healthy volunteer (selection) bias. People who attend screening differ from those who do not.
Evidence for different programs varies. Cervical screening using the Pap test and later HPV testing has strong evidence of reducing cervical cancer incidence and mortality. For breast and prostate cancer, large trials reported small reductions in disease-specific mortality alongside notable overdiagnosis, and expert groups differ in recommendations about ages and intervals. Never treat a general principle as a verdict on a specific test; check current guidelines and discuss personal decisions with a clinician.
Common misconceptions
"A test with 95% accuracy means a positive result is 95% likely to be right." Predictive values depend on prevalence. In rare diseases most positives can be false.
"Longer survival after screening proves screening works." Lead-time and length-time bias can inflate survival without any reduction in deaths.
"Early detection is always better." It helps only if early treatment improves outcomes and the harms of overdiagnosis are smaller than the benefits.
"Sensitivity and PPV are the same thing." Sensitivity starts from people with disease, PPV starts from people with positive tests.
Try it
First, an interactive icon array of 1,000 people. Adjust prevalence, sensitivity and specificity to see how the numbers of true and false positives change. This is a teaching demonstration about screening arithmetic, not a diagnostic tool.
Second, a Python demonstration of the ROC curve for a test whose results are normally distributed in healthy and diseased people (invented parameters), and of PPV as a function of prevalence.
Press Run (or Ctrl + Enter) to see the result here.
Program input · what you'd type while the program runs
Type the answers before you press Run, one per line. Each time the program reads a line (with input()), it gets the next line from this box.
Check your understanding
Quick check · 5 questions
of 5 answered You scored / 5 · perfect!
-
1. A test has 80% sensitivity. Among 200 people with the disease, how many test positive?
Sensitivity is the proportion of diseased people who test positive: 0.8 x 200 = 160. -
2. Which change increases the PPV of a screening test most directly, with the same test?
PPV rises with prevalence: the same test gives more true positives among people at higher risk. -
3. Screening finds a cancer 3 years earlier, but the patient dies at the same age as without screening. This illustrates:
Survival from diagnosis looks longer, but the date of death is unchanged. -
4. A negative result from a test with high sensitivity is especially useful for:
With few false negatives, a negative result makes disease unlikely (the rule-out logic). -
5. Why might a screening program cause net harm?
Harms such as anxiety, extra tests and overtreatment can outweigh benefits.
Summary
- Sensitivity and specificity describe a test; PPV and NPV describe what a result means in a given population and depend on prevalence.
- Natural frequencies make the base-rate problem clear: rare disease means many false positives.
- ROC curves show the trade-off between sensitivity and specificity as the threshold changes.
- Good screening requires an important condition, an effective early treatment and a test with acceptable performance and harms.
- Lead-time, length-time and overdiagnosis biases mean screening must be judged by mortality in trials, not survival after diagnosis.
Next: Prevention strategies
Track your progress
Create a free account to tick off lessons and pick up where you left off on any device.
of Public Health and Epidemiology lessons completed