


















Lesson 9 of 46 · Foundations of Public Health
Chapter 2 review: history, determinants and prevention
Review chapter 2: milestones from Jenner to Ottawa, John Snow's comparison, the determinants and social gradient, and the levels of prevention, with a nine-question quiz.
This chapter gave you the background that the rest of the course assumes: how public health learned its methods, what shapes health, and where prevention can act. Use this review to check that the ideas are secure before you start measuring disease in chapter 3.
What you will learn
- A one-page recap of chapter 2.
- The facts and numbers worth remembering.
- A nine-question quiz that mixes all three lessons.
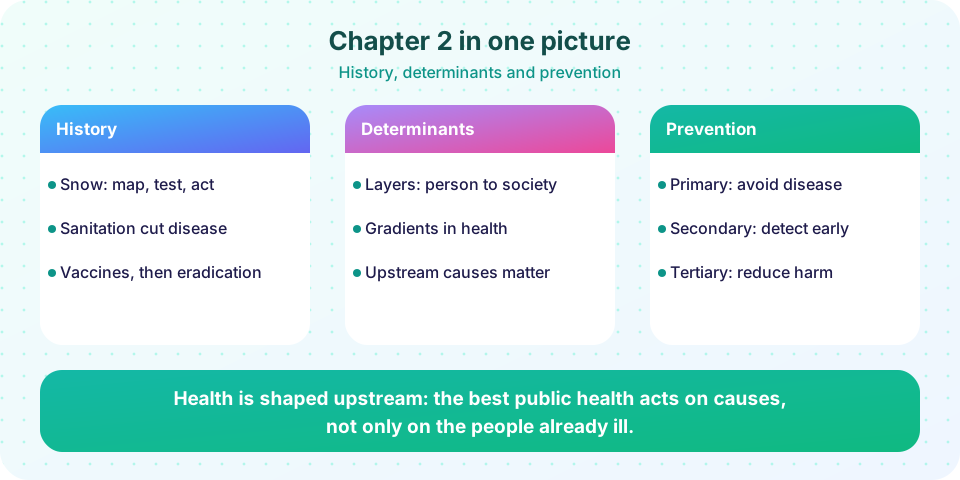
Chapter in one table
| Topic | Key points | Numbers and names |
|---|---|---|
| History | Counting and comparing groups revealed causes before microbes were known; sanitation and vaccination drove early gains | Jenner 1796; Chadwick 1842; Snow 1854; WHO 1948; Alma-Ata 1978; smallpox eradicated 1980; Ottawa 1986 |
| Snow's evidence | Map around the Broad Street pump plus a natural experiment on two water companies | About 315 vs 37 deaths per 10,000 houses; ratio about 8 |
| Determinants | Layers from fixed factors and lifestyle to society and environment; the social gradient; upstream causes | Dahlgren and Whitehead 1991; Whitehall studies, Marmot; Lalonde 1974 |
| Measuring inequality | Rate ratio (relative), rate difference (absolute), excess deaths | Report both relative and absolute measures |
| Prevention | Primordial, primary, secondary, tertiary (and quaternary) | Vaccines; screening; rehabilitation |
| Screening | Sensitivity, specificity, PPV; PPV falls when prevalence falls | 90 % sensitive, 95 % specific, 1 % prevalence: PPV about 15 % |
Ideas to be able to explain
- Why was Snow's water-company comparison more convincing than his map alone?
- What is the social gradient, and why does it matter that it appeared among people who all had secure jobs?
- Why might a policy aimed at the whole population prevent more deaths than one targeting only the poorest group?
- Give one example each of primary, secondary and tertiary prevention for heart disease.
- Why can a test with high specificity still produce mostly false positives?
Possible answers: (1) the comparison had explicit denominators and groups that were alike except for their water, so it ruled out many alternative explanations, while a map can only show clusters; (2) gradients show that health depends on social position at every level, not only on poverty, and ruled out lack of access to care as the only explanation; (3) when the middle groups are large, they hold most of the excess burden, as in the demonstration with invented numbers; (4) primary: tobacco control; secondary: blood pressure and cholesterol screening; tertiary: cardiac rehabilitation; (5) when the disease is rare, the large healthy group generates more false positives than the small sick group generates true positives.
A worked screening problem
A hypothetical test has 80 percent sensitivity and 90 percent specificity and is used on 1,000 people, of whom 5 percent (50 people) have the disease. The test finds 0.80 x 50 = 40 of the 50 sick people and misses 10. Among the 950 healthy people, 10 percent, or 95, test positive by mistake, and 855 correctly test negative. There are 40 + 95 = 135 positive results, of which 40 are real, so the positive predictive value is 40 / 135, about 30 percent. Even with a decent test and a prevalence of 5 percent, seven of every ten positives are false alarms. Increase the prevalence to 20 percent (a high-risk group) and the same test gives a much higher PPV, which is why screening programs target groups at higher risk.
A worked inequality problem
In a city, the death rate is 12 per 1,000 per year in the most deprived fifth and 8 per 1,000 in the least deprived fifth. The rate ratio is 12 / 8 = 1.5 and the rate difference is 4 per 1,000 per year. If each fifth has 100,000 residents, the excess deaths in the most deprived group, compared with the least deprived rate, are 100,000 x 4 / 1,000 = 400 per year. If rates in both groups fall by a quarter, the ratio stays at 1.5, while the difference falls to 3 per 1,000, which shows why both relative and absolute measures need reporting.
Try it
Check your understanding
Quick check · 9 questions
of 9 answered You scored / 9 · perfect!
-
1. Which pair is correctly matched?
Jenner tested cowpox inoculation in 1796. Chadwick wrote the 1842 sanitary report, Snow made the pump map and Koch's team identified Vibrio cholerae. -
2. Snow's rate for the polluted supply was about 315 deaths per 10,000 houses and about 37 for the cleaner one. The rate ratio is about
315 divided by 37.5 is about 8.4. -
3. In the rainbow model, housing and employment belong to which layer?
Housing, jobs, education and health services are the living and working conditions. -
4. What did the Whitehall studies show about civil servants?
Mortality was higher at each lower grade, and standard risk factors explained only part of it. -
5. Rates halve in both the most and least deprived groups. What happens to the rate ratio and the rate difference?
A ratio of two rates is unaffected by halving both, while the absolute difference is halved. -
6. A free vaccination program is an example of
Vaccination prevents disease in healthy people. -
7. A screening test has 90 percent sensitivity and 95 percent specificity. In a group where 1 percent have the disease, the PPV is closest to
Of 10,000 people: 90 true positives and 495 false positives, so PPV = 90 / 585, about 15 percent. -
8. Equity differs from equality because equity
Equity means tailoring resources to need to reduce unfair differences. -
9. Which finding is a reason to avoid judging a screening program only by survival time after diagnosis?
Earlier diagnosis can lengthen apparent survival without delaying death, so deaths from the disease are a better measure.
Summary
- History shows that counting and comparing groups, plus sanitation and vaccines, built public health.
- Health is shaped by layered determinants, with a social gradient that calls for action across the whole population.
- Prevention acts at several levels; screening needs accurate tests and evidence of improved outcomes.
- Report inequality with ratios, differences and excess deaths.
Track your progress
Create a free account to tick off lessons and pick up where you left off on any device.
of Public Health and Epidemiology lessons completed