


















Lesson 4 of 46 · Getting Started
Chapter 1 review: getting started with public health
Review chapter 1: public health, the three core functions, the prevention paradox, denominators and the epidemiologic habits, with a recap table and a ten-question quiz.
You have finished the opening chapter. You know what public health is, how it differs from clinical care, and the five habits that make epidemiologic thinking different from reading headlines. This review pulls those ideas into one picture, one table and one quiz.
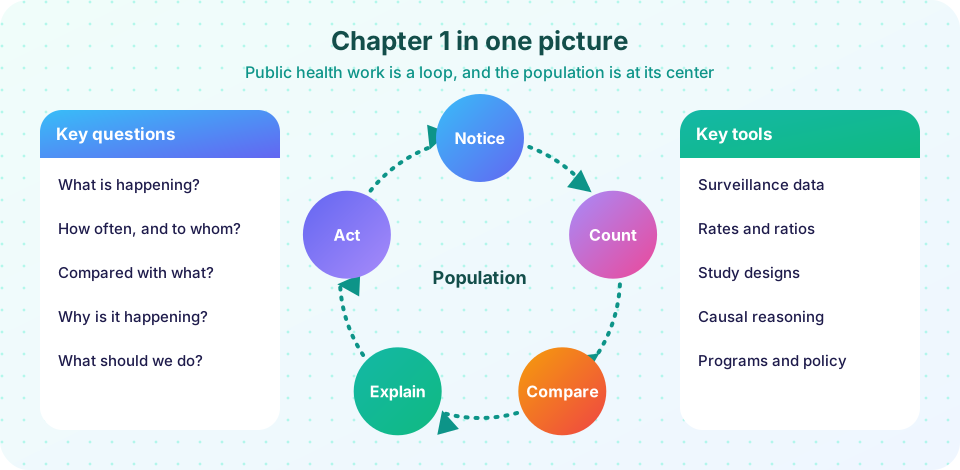
What you will learn
- A one-page recap of chapter 1.
- Which ideas to be able to explain without notes.
- How well you have understood them, through a ten-question quiz.
Chapter in one table
| Idea | Core statement | Remember it as |
|---|---|---|
| Public health | Preventing disease and promoting health through organized effort, for populations | The population is the patient |
| Core functions | Assessment, policy development, assurance | Look, decide, deliver, repeat |
| Prevention paradox | Shifting a whole distribution a little can prevent more cases than treating only the high-risk few | Many people, small risk, big total |
| Case definition | A written rule deciding who counts as a case | Same rule for everyone |
| Denominator | The population at risk | Out of how many? |
| Risk | New cases divided by people at risk in a period | Cases / at risk |
| Comparison | Epidemiology compares places, times and people | Compared with what? |
| Person, place, time | The three axes of description | Who, where, when |
| Epidemiologic triangle | Agent, host, environment (plus vector) | Three corners to act on |
Questions you should be able to answer
Test yourself without looking back:
- Why does a public health success often leave no visible trace?
- What is the difference between the high-risk strategy and the population strategy? Give one example of each.
- A school has 12 cases among 60 pupils. What is the risk, and why is that more informative than "12 cases"?
- What does an epidemic curve with one sharp peak suggest, and why?
- Name one control measure aimed at each corner of the triangle for a foodborne outbreak.
Suggested answers: (1) because prevented illnesses are never recorded, so we need rates and comparisons; (2) the high-risk strategy treats those at the top of the distribution, such as medicine for very high blood pressure, while the population strategy shifts everyone, such as less salt in processed food; (3) 12/60 = 0.20, or 20 percent, which allows comparison with other schools; (4) a point-source exposure, because many people were exposed at about the same time and fell ill within one incubation period; (5) agent: cook food thoroughly; host: vaccinate or exclude ill food handlers; environment: fix refrigeration and kitchen layout.
A worked mini-problem
Two neighboring towns report influenza in March. Town P (8,000 residents) has 40 cases; Town Q (2,000 residents) has 20 cases. A careless reader says Town P is worse, because 40 is twice 20. Apply the habits of the chapter. The denominator for P is 8,000, so the risk is 40 / 8,000 = 0.005, or 0.5 percent. For Q it is 20 / 2,000 = 0.010, or 1.0 percent. Town Q has twice the risk even though it has half the cases. Next ask the comparison questions: were both towns using the same case definition, and did both look equally hard for cases? If Q has a clinic that tests more people, part of the difference could be due to detection rather than disease. Describe the cases by person, place and time before deciding what to do. This tiny example uses almost every idea in the chapter: counts versus risk, case definition, comparison and description.
Where the chapter leads
Chapter 2 now asks where these ideas came from and what shapes health in the first place. Chapters 3 and 4 then turn the informal habits of this chapter into precise measures and study designs, and chapter 5 teaches you to decide whether an observed difference is a cause.
Try it
Check your understanding
Quick check · 10 questions
of 10 answered You scored / 10 · perfect!
-
1. Which is an example of the assurance function?
Assurance makes sure services reach everyone and that programs are evaluated. The survey is assessment and the tax is policy development. -
2. A single doctor treating a patient with measles is mainly doing
Clinical care treats the patient; reporting the case feeds surveillance, linking it to public health. -
3. Why do most cases in a population often come from people at moderate risk rather than from the highest-risk few?
A moderate risk times a very large group can exceed a high risk times a small group. This is the logic of the prevention paradox. -
4. A town of 5,000 people has 25 new cases in a month. What is the risk for that month?
25 / 5,000 = 0.005, which is 0.5 percent. -
5. Which is the best reason to use a case definition?
Consistent criteria make comparisons fair and counts meaningful. -
6. Which would be the BEST denominator for the risk of cervical cancer in a country?
The denominator should include only people who could develop the outcome, the population at risk. -
7. An epidemic curve that rises in several successive waves most suggests
Successive waves, each about one incubation period apart, are typical of propagated spread. -
8. In the epidemiologic triangle, vaccinating people acts on the
Vaccination raises the immunity of the host. -
9. Which sentence is correct?
Equal counts can hide very different risks when denominators differ. -
10. Which habit is described by the question 'compared with what?'
Epidemiology is a science of comparison between places, times and groups of people.
Summary
- Public health targets populations through assessment, policy development and assurance.
- Population-wide shifts can beat treating only high-risk people (the prevention paradox).
- Epidemiologic thinking: define the case, find the denominator, compare, describe by person, place and time, test hypotheses.
- Risk = new cases / population at risk; counts alone mislead.
Track your progress
Create a free account to tick off lessons and pick up where you left off on any device.
of Public Health and Epidemiology lessons completed