


















Lesson 14 of 46 · Measuring Disease
Measures of association: risk ratio, risk difference and odds ratio
Build the 2 x 2 table and compute risk ratio, risk difference, odds ratio, attributable fractions, vaccine efficacy and number needed to treat, with confidence intervals.
A headline reads: "Eating processed meat raises cancer risk by 18 percent." Should you be worried? The answer depends on whether that 18 percent is relative to a risk of 1 in 100 or 1 in 100,000, whether it comes from a ratio of risks or of odds, and how uncertain the estimate is. Measures of association put a number on the strength of the link between an exposure and an outcome, and learning to compute and interpret them is a core skill of epidemiology.
This lesson builds the two-by-two table, derives the three basic measures (risk ratio, risk difference, odds ratio), shows how to express protective effects such as vaccine efficacy, and ends with attributable fractions and the number needed to treat, the measures that connect a study result to public health impact.
What you will learn
- How to set out a 2 x 2 table and compute RR, RD and OR from it.
- How to interpret values above, equal to and below the null.
- Vaccine efficacy, attributable fractions and the number needed to treat.
- Why relative and absolute measures must be read together.
Key terms
- Exposure: a factor whose effect we study (smoking, a vaccine, a pollutant).
- Risk ratio (relative risk, RR): risk in the exposed divided by risk in the unexposed.
- Risk difference (attributable risk, RD): risk in the exposed minus risk in the unexposed.
- Odds ratio (OR): odds of disease in the exposed divided by odds in the unexposed.
- Number needed to treat (NNT): the number of people who must receive an intervention for one to benefit, equal to 1 / absolute risk reduction.
The two-by-two table
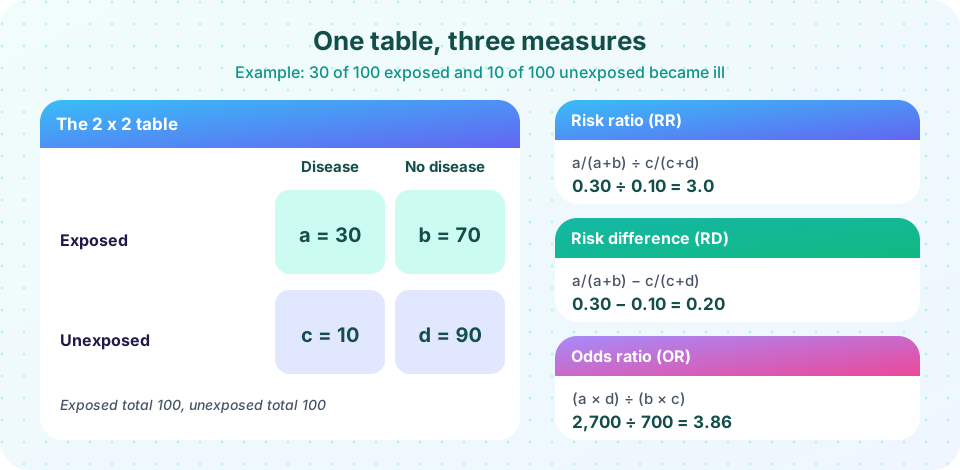
Suppose 100 people were exposed to a risk factor and 100 were not, and everyone was followed to see who developed a disease. The results fit into a 2 x 2 table:
| Disease | No disease | Total | |
|---|---|---|---|
| Exposed | a = 30 | b = 70 | 100 |
| Unexposed | c = 10 | d = 90 | 100 |
From this one table, we get all the basic measures. Memorize which cell is which (exposed first, then disease first); mixing them up is the most common calculation mistake.
Risk ratio
The risk in the exposed is a / (a + b) = 30/100 = 0.30, and in the unexposed c / (c + d) = 10/100 = 0.10. The risk ratio (also called relative risk) divides one by the other:
RR = [a / (a + b)] / [c / (c + d)] = 0.30 / 0.10 = 3.0
Interpretation:
- RR = 1: no association (the null value).
- RR > 1: the exposure is associated with higher risk. RR = 3 means three times the risk, or 200 percent higher.
- RR < 1: the exposure is associated with lower risk (protective).
Be careful with the words: "three times as high" (RR = 3) is not "three times higher" in strict usage, which can mean RR = 4, so use "three times as likely" or "200 percent higher".
The RR can be computed from cohort studies and trials, where you know the risks. When you are working with rates, the analogous measure is the rate ratio.
Risk difference
The risk difference (absolute risk difference, attributable risk) subtracts instead of dividing:
RD = 0.30 - 0.10 = 0.20
It says that 20 extra cases occur per 100 exposed people, because of the exposure, if the association is causal. The RD speaks to public health impact, since it tells you how many cases the exposure adds. If the RD is expressed per 1,000 or 100,000, it can be used to estimate the number of cases a program could prevent.
Why you need both: relative and absolute
Suppose a drug doubles the risk of a rare side effect from 1 in 10,000 to 2 in 10,000. The RR is 2, which sounds alarming, but the RD is 1 in 10,000, a very small absolute increase. Conversely, an RR of 1.2 for a common outcome such as heart disease, with a risk of 20 percent, represents an RD of 4 percentage points, which can be substantial across a population. Relative measures are best for judging how strongly an exposure is linked to disease (for causal inference), because they are fairly stable across populations. Absolute measures are best for judging impact and for communicating risk to individuals. Good reporting gives both. When you read a headline with only a relative figure, ask for the baseline risk.
Odds ratio
The odds of disease among the exposed is a / b = 30 / 70 = 0.43, among the unexposed c / d = 10 / 90 = 0.11. The odds ratio divides them:
OR = (a/b) / (c/d) = (a × d) / (b × c) = (30 × 90) / (70 × 10) = 2,700 / 700 = 3.86
The OR (the "cross-product ratio") is always farther from 1 than the RR when the disease is common, here 3.86 versus 3.0. When the disease is rare, so that a is small compared with b and c is small compared with d, OR and RR are almost equal. The OR matters because it is the only measure that can be estimated from a case-control study, where the investigator chooses the numbers of cases and controls, so risks cannot be calculated (chapter 4). It is also the output of logistic regression. A common error is to read an OR as if it were an RR; for common outcomes this exaggerates the strength of association.
Confidence intervals
An estimate from a sample is uncertain. A confidence interval (CI) gives a range of plausible values. For RR and OR, the CI is computed on the log scale. For example, the standard error of the log RR is sqrt(1/a - 1/(a+b) + 1/c - 1/(c+d)), and the 95 percent CI is RR × exp(±1.96 × SE). For the table above, the RR of 3.0 has a 95 percent CI of about 1.6 to 5.8, and the OR of 3.86 has a CI of about 1.8 to 8.4. If the interval for a ratio excludes 1, the result is "statistically significant" at the 5 percent level. But note how wide the interval is: the data are consistent with a modest or a very strong effect. Chapter 5 returns to intervals and p-values.
Protective exposures: vaccine efficacy
When RR < 1, the exposure protects. Imagine a randomized trial of a vaccine in which 8 of 1,000 vaccinated and 40 of 1,000 unvaccinated participants develop the disease. The risk in the vaccinated is 0.008 and in the placebo group 0.040, so RR = 0.20. Vaccine efficacy is defined as the percent reduction in risk: VE = (1 - RR) × 100 = 80 percent. The absolute risk reduction is 0.040 - 0.008 = 0.032, and the number needed to vaccinate to prevent one case is 1 / 0.032, about 31. The same pattern, relative risk reduction (the percentage) alongside absolute risk reduction and NNT, applies to treatments.
Impact measures
Attributable fraction among the exposed (AFe): (RR - 1) / RR. It is the share of cases in the exposed group that could be avoided if the exposure were absent, assuming causality. For RR = 3, AFe = 2/3, about 67 percent. For a smoker with lung cancer, this answers: how much of the risk is attributable to smoking?
Population attributable fraction (PAF): the share of all cases in the population due to the exposure: PAF = p × (RR - 1) / (1 + p × (RR - 1)), where p is the proportion of the population exposed. With RR = 3 and 30 percent exposed, PAF = 0.3 × 2 / (1 + 0.6) = 0.375, roughly three-eighths of all cases. It combines the strength of the association and how common the exposure is, which is why a modest risk factor that is very common (for example, physical inactivity) can account for more cases than a strong risk factor that is rare.
Number needed to treat (NNT) or to harm (NNH): 1 / RD. In the table, 1 / 0.20 = 5: for every five people exposed, one extra case occurs. NNT makes a benefit concrete: an NNT of 5 is impressive; an NNT of 500 means that many must be treated for one to benefit, which may still be worthwhile if the treatment is cheap and safe.
These impact measures rest on the assumption that the association is causal, which we cannot take for granted. Chapter 5 shows how bias and confounding can produce spurious associations.
Common misconceptions
"An RR of 2 means a 2 percent increase." It means the risk is doubled, a 100 percent increase. Always check what is relative to what.
"OR and RR are interchangeable." They are close only if the disease is rare. For common outcomes the OR overstates the RR.
"A large relative risk means a large absolute impact." It may not: a doubling of a very rare risk affects very few people. Look at the absolute risk and the PAF.
"A confidence interval that includes 1 proves no effect." It means the data are compatible with no effect, but also with effects in both directions, particularly when the interval is wide.
Try it
Press Run (or Ctrl + Enter) to see the result here.
Program input · what you'd type while the program runs
Type the answers before you press Run, one per line. Each time the program reads a line (with input()), it gets the next line from this box.
Press Run (or Ctrl + Enter) to see the result here.
Program input · what you'd type while the program runs
Type the answers before you press Run, one per line. Each time the program reads a line (with input()), it gets the next line from this box.
Check your understanding
Quick check · 5 questions
of 5 answered You scored / 5 · perfect!
-
1. In a cohort, 20 of 200 smokers and 5 of 250 non-smokers develop a disease. The risk ratio is
Risk in smokers 20/200 = 0.10; non-smokers 5/250 = 0.02; RR = 0.10 / 0.02 = 5. -
2. In the same data, what is the risk difference?
0.10 - 0.02 = 0.08, or 8 extra cases per 100 smokers. -
3. A vaccine trial gives RR = 0.25. What is the vaccine efficacy?
VE = (1 - RR) x 100 = 75 percent. -
4. When does the odds ratio approximate the risk ratio well?
When disease is rare, a is small relative to b and c small relative to d, so the odds are almost equal to the risks. -
5. An absolute risk reduction of 0.04 corresponds to a number needed to treat of
NNT = 1 / ARR = 1 / 0.04 = 25.
Summary
- Fill a 2 x 2 table carefully, then compute RR (ratio of risks), RD (difference of risks) and OR (ratio of odds).
- Values of 1 (ratios) or 0 (differences) mean no association; below the null means protection.
- Vaccine efficacy = (1 - RR) x 100; NNT = 1 / absolute risk reduction; AFe = (RR - 1) / RR; PAF depends on both RR and how common the exposure is.
- Read relative and absolute measures together, and include confidence intervals.
Next: Chapter 3 review
Track your progress
Create a free account to tick off lessons and pick up where you left off on any device.
of Public Health and Epidemiology lessons completed