


















Lesson 3 of 46 · Getting Started
How epidemiologists think: denominators, comparison and the big questions
Learn the habits of epidemiologic thinking: define the case, find the denominator, compare groups, describe person, place and time, and use the epidemiologic triangle.
A newspaper says "30 children fell ill at River School this week." Is that alarming? You cannot tell. If River School has 3,000 pupils, it is a small cluster. If it has 200 pupils, it is an emergency. The number 30 means nothing until you divide it by something and compare it with something else. This single habit, asking "out of how many, and compared with what?", is the heart of epidemiology.
This lesson introduces the way epidemiologists approach any health problem, from a food-poisoning outbreak to a decades-long study of heart disease. You will learn the standard definition, the five steps of reasoning that nearly every investigation follows, and a simple model, the epidemiologic triangle, for organizing causes.
What you will learn
- A standard definition of epidemiology and its two main goals.
- Why every count needs a denominator and a comparison.
- How to describe an outbreak by person, place and time.
- How the epidemiologic triangle organizes agent, host and environment.
Key terms
- Case definition: the agreed criteria (clinical, laboratory, time, place) that decide who counts as a case.
- Population at risk: the people who could develop the outcome during the period studied.
- Risk: the proportion of a population at risk that develops the outcome in a given time.
- Determinant: a factor that influences the occurrence of disease.
- Hypothesis: a testable explanation for a pattern, such as "the chicken salad made people ill".
The definition
A widely used definition says that epidemiology is the study of the occurrence and distribution of health-related states or events in specified populations, including the study of the determinants influencing those states, and the application of this knowledge to control health problems. Break it into three parts:
- Distribution: who is affected, where and when (descriptive epidemiology).
- Determinants: why, meaning the causes and risk factors (analytic epidemiology).
- Application: what to do about it (the public health purpose).
The roots are old. The Greek physician Hippocrates (around 400 BCE) wrote a treatise, Airs, Waters, Places, urging doctors to notice how seasons, water sources and location shape disease. But modern epidemiology became a quantitative science only when people started counting cases and comparing rates, as you will see in the history lesson.
Habit 1: define the case
Before counting anything you need a case definition: a written rule that says who counts. For an outbreak of gastroenteritis, it might read: "any pupil or staff member at River School with diarrhea (three or more loose stools in 24 hours) or vomiting, with onset between 1 and 8 March." Case definitions have layers. A confirmed case has laboratory proof, a probable case has typical symptoms plus a link to a confirmed case, and a suspected case has only some symptoms. Early in an outbreak a broad definition catches more cases; later a narrow one avoids false positives. The key rule is to apply the same definition to everyone, otherwise you cannot compare groups fairly.
Habit 2: find the denominator
A count is the numerator. To judge its size, divide by the population at risk, the denominator:
risk = number of new cases ÷ number of people at risk
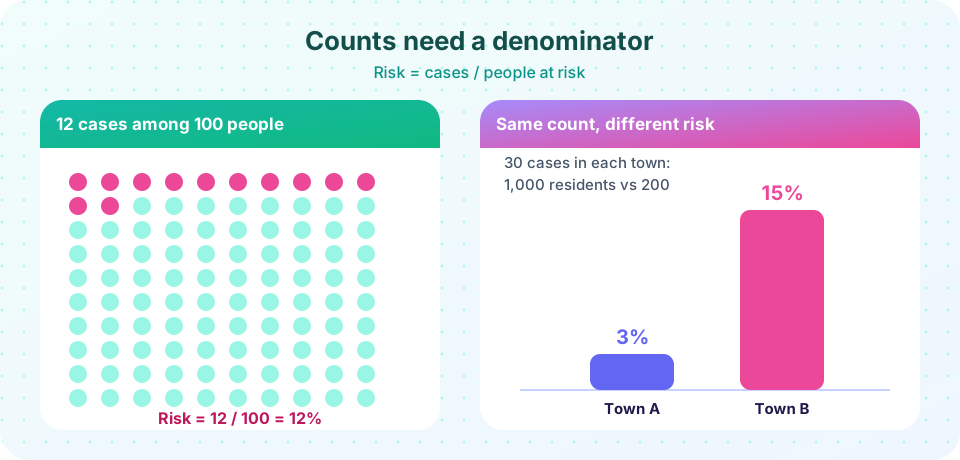
Back to River School: 30 cases among 200 enrolled gives a risk of 30/200 = 0.15, or 15 percent. At North School, 30 cases among 1,000 pupils gives 0.03, or 3 percent. The count is identical, the risk is five times larger at River School. The picture above shows the same idea.
"At risk" means the person could actually develop the outcome. Counting men in the denominator of cervical cancer, or people already immune to measles in the denominator of a measles outbreak, dilutes the risk and hides the signal. Finding the right denominator is often the hardest part of an investigation, because a population may be fluid (people move, travel and are born), and counts of people are often less reliable than counts of cases.
Habit 3: compare
Even a correct risk means little in isolation. Is 15 percent high? Compared with what? Epidemiology is a science of comparison. We compare:
- Places: River School with North School.
- Times: this year with last year, before a program with after it.
- People: those who ate the chicken salad with those who did not; smokers with non-smokers; vaccinated with unvaccinated.
Every study design you will meet in chapter 4 is a different clever way to arrange comparisons. Notice the hidden requirement: the groups being compared must be alike in all the ways that matter except the factor you are studying. If they are not, a difference may be due to something else. That problem, called confounding, is the subject of chapter 5.
Habit 4: describe by person, place and time
Descriptive epidemiology sorts cases along three axes, an approach that goes back more than a century.
- Person: age, sex, occupation, vaccination status, behaviors, income. Outbreaks that affect mainly children point to school settings or childhood diseases.
- Place: home address, school, workplace, region or country. A cluster around one water source suggests a shared exposure.
- Time: the date of onset, plotted as an epidemic curve (a histogram of cases by day or week). A sharp peak followed by a fall suggests a single shared exposure; a series of rising waves suggests person-to-person spread; a flat, long curve suggests a continuing source or an endemic disease.
The second demonstration below sorts a tiny invented line list by person, place and time, exactly the first step of a real investigation. The patterns it reveals (mostly children, mostly one school building, onset spread across several days) become hypotheses: educated guesses to test with analytic methods.
Habit 5: form and test hypotheses
A good hypothesis is specific and testable: "Pupils who ate the cold lunch on 2 March were more likely to become ill than pupils who did not." To test it, you compare the risk in the two groups, which gives a ratio of risks (chapter 3). If the risk is much higher among those who ate the lunch, the hypothesis is supported, though not yet proved: other differences between the groups, chance and measurement error all need to be considered.
Notice the cycle: describe the pattern, generate a hypothesis, test it, act, and then check whether the action worked. The five habits are essentially the scientific method applied to health in populations.
The epidemiologic triangle
To organize possible causes of infectious disease, epidemiologists use the epidemiologic triangle, with three corners:
- Agent: the microbe or substance that causes disease (a virus, bacterium, toxin, or for injuries, energy such as a car crash).
- Host: the person, with their age, genes, immunity, nutrition and behavior.
- Environment: the setting that brings agent and host together: crowding, climate, water, food handling, health services.
Some diseases also need a vector, such as a mosquito that carries malaria between humans. Control can aim at any corner: kill or neutralize the agent (treat water, cook food), protect the host (vaccinate, nourish), or change the environment (drain standing water, ventilate rooms). For non-infectious problems such as heart disease, the same idea generalizes to a web of many causes, which we explore in chapters 2 and 5.
What epidemiology is not
Epidemiology finds patterns and associations and, with careful design, evidence on causes. It does not tell you whether a particular person's disease was caused by a particular exposure. It also cannot replace laboratory science: a laboratory can show how a toxin damages a cell, while epidemiology shows whether people exposed to the toxin get more disease in the real world. The two approaches complement each other.
Common misconceptions
"More cases means a bigger problem." Not necessarily. A large population produces more cases at the same risk. Compare rates and risks, not raw counts.
"If two things happen together, one caused the other." Association is only the first step. Chance, bias and confounding can produce associations without cause (chapter 5).
"An outbreak is only about the first case." The first case matters, but control depends on understanding exposure, spread and who is still susceptible.
Try it
Press Run (or Ctrl + Enter) to see the result here.
Program input · what you'd type while the program runs
Type the answers before you press Run, one per line. Each time the program reads a line (with input()), it gets the next line from this box.
Press Run (or Ctrl + Enter) to see the result here.
Program input · what you'd type while the program runs
Type the answers before you press Run, one per line. Each time the program reads a line (with input()), it gets the next line from this box.
Check your understanding
Quick check · 5 questions
of 5 answered You scored / 5 · perfect!
-
1. Town A has 40 cases among 2,000 people at risk. What is the risk?
Risk = 40 / 2,000 = 0.02, which is 2 percent. -
2. Why must everyone in an investigation be classified with the same case definition?
If different groups are judged by different criteria, differences in rates may only reflect the criteria. -
3. An epidemic curve with one sharp peak and then a fall most suggests which situation?
A point-source outbreak produces a rapid rise and fall as everyone exposed at about the same time falls ill within one incubation period. -
4. In the epidemiologic triangle, which of these belongs to the environment corner?
Agent is the cause (the virus), host is the person (immunity), environment is the setting such as crowding, water or climate. -
5. Which pair of terms correctly describes a risk calculation?
Risk = new cases (numerator) divided by the population at risk (denominator).
Summary
- Epidemiology studies the distribution and determinants of health states in populations, to control health problems.
- The habits: define the case, find the denominator, compare, describe by person, place and time, and form testable hypotheses.
- Counts need denominators: risk = new cases / population at risk.
- The epidemiologic triangle (agent, host, environment, plus vector) shows where control can act.
Next: Chapter 1 review
Track your progress
Create a free account to tick off lessons and pick up where you left off on any device.
of Public Health and Epidemiology lessons completed