


















Lesson 11 of 46 · Measuring Disease
Ratios, proportions and rates: the building blocks of measurement
Learn the difference between a ratio, a proportion and a rate, how to build an incidence rate from person-time, when to use risk or odds, and how to scale per 1,000 or 100,000.
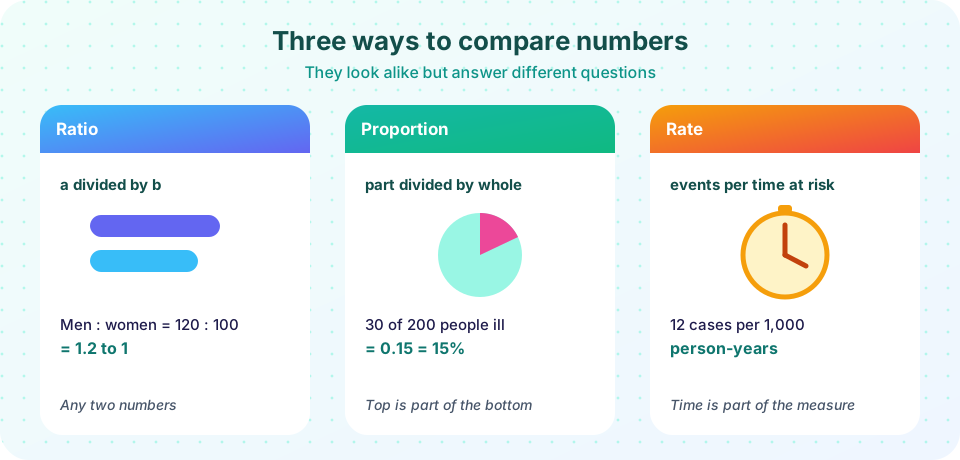
Epidemiology uses three kinds of fractions, and they are easy to confuse because all of them are a number divided by a number. A ratio compares any two quantities. A proportion is a part divided by the whole that includes it. A rate measures how fast events occur over time. Using the wrong one is a common source of confusion in news reports and in student answers, and the differences become important when you compare groups followed for different lengths of time.
This lesson defines each carefully, shows how to turn follow-up of individuals into person-time, explains the scaling conventions (per 1,000, per 100,000), and introduces odds, which return in the lesson on measures of association.
What you will learn
- How to compute and recognize a ratio, a proportion and a rate.
- What person-time is and how to calculate an incidence rate from follow-up data.
- Why some epidemiologic "rates" are actually proportions.
- How to scale measures and convert between proportions and odds.
Key terms
- Ratio: one quantity divided by another; the numerator need not be part of the denominator.
- Proportion: a ratio in which the numerator is part of the denominator, so it lies between 0 and 1.
- Rate: the number of events per unit of person-time at risk.
- Person-time: the sum, over everyone studied, of the time each person spent at risk (person-years, person-months).
- Odds: the probability that an event happens divided by the probability that it does not.
Ratio: any number over any number
A ratio is a / b, where a and b are separate quantities. The numerator is not necessarily included in the denominator. In a town with 120 men and 100 women, the sex ratio is 120:100, or 1.2 to 1. Other examples: the ratio of doctors to residents, the ratio of the death rate in smokers to the death rate in non-smokers (a rate ratio), or the ratio of one hospital's case count to another's. Ratios may be any positive number, and they are commonly expressed with a unit-free value or as "x to 1".
Proportion: a part of a whole
A proportion has the numerator inside the denominator: proportion = part / whole. It always lies between 0 and 1 and is often written as a percent. If 30 of 200 people at a wedding became ill, the proportion ill is 30/200 = 0.15, or 15 percent. A proportion has no time dimension on its own, so when we use it as a measure of disease we must state the period. That is why the risk of disease, "the proportion of people at risk who develop the disease during a specified period", always comes with a time: 5-year risk, lifetime risk.
Several measures in epidemiology are proportions despite the word "rate" in their names:
- Attack rate: the proportion of an exposed group who become ill during an outbreak.
- Case fatality rate (case fatality): the proportion of people with a disease who die of it.
- Prevalence: the proportion of a population that has the disease at a given time.
The names stuck for historical reasons. When you meet a "rate", check whether time is in the denominator. If not, it is a proportion.
Rate: events per person-time
A true rate has time in the denominator. Suppose we follow people for a while, and we want to count new events relative to the amount of time at risk. The denominator is person-time, the total time that all individuals were at risk, added up:
incidence rate = number of new events / total person-time at risk
Why not simply divide by the number of people? Because people are not all followed for the same duration. Some join late, some leave early (they move away, die of another cause or withdraw), and some develop the event and stop being "at risk" for it. Counting each person as one unit would ignore that. Person-time gives each person's contribution in proportion to how long they were actually observed.
Take eight people followed for up to five years. Four are followed for the entire five years without the event; three develop the event, at 1.2, 2.8 and 3.5 years; and one is lost to follow-up at 4 years. The total follow-up is 5 + 3.5 + 5 + 1.2 + 4 + 5 + 2.8 + 5 = 31.5 person-years. There are 3 events, so the incidence rate is 3 / 31.5 = 0.095 per person-year, or about 95 per 1,000 person-years. A naive proportion, 3 out of 8 = 0.375, ignores that people were followed for different durations. The first demonstration draws these follow-up lines and computes the numbers.
The unit of a rate matters. A rate of 0.095 per person-year is the same as 9.5 per 100 person-years or 95 per 1,000 person-years. Unlike a proportion, a rate can exceed 1: three events in half a person-year is 6 per person-year. This does not mean a person can be 600 percent ill; it just means events are happening fast.
Open and closed populations
A closed (fixed) cohort has no entries or exits except through the event: we can compute risks directly. An open (dynamic) population, such as the people living in a city, constantly changes. For an open population, we estimate person-time approximately as the mid-year population multiplied by the length of the period. That is how the annual mortality rate of a country is calculated: deaths in the year divided by the mid-year population.
Scaling: per 1,000 and per 100,000
Small fractions are awkward to read, so we multiply by a convenient power of ten. The multiplier is chosen to give a figure with at least one digit before the decimal point. Crude birth and death rates are given per 1,000 per year; cancer rates per 100,000 per year; maternal mortality per 100,000 live births; infant mortality per 1,000 live births. Always state the multiplier, and when you compare numbers, make sure they use the same one. A death rate of 3 per 1,000 is 300 per 100,000, which is not the same as "3".
Risk, rate and odds compared
| Measure | Formula | Range | Includes time? |
|---|---|---|---|
| Risk (cumulative incidence) | new cases / people at risk at start | 0 to 1 | Stated period |
| Incidence rate | new cases / person-time | 0 to infinity | Yes, in denominator |
| Odds | cases / non-cases | 0 to infinity | Stated period |
| Prevalence | existing cases / population at a time | 0 to 1 | A moment or short period |
Odds are an alternative way to express a probability. If the proportion with an event is p, then odds = p / (1 - p). A proportion of 0.15 corresponds to odds of 0.15 / 0.85 = 0.176, or about 3 to 17. Odds are not as intuitive as risk, but they have mathematical properties that make them essential for logistic regression and for case-control studies (chapter 4). When the event is rare, odds and proportion are almost equal (a proportion of 0.01 has odds of 0.0101). When the event is common, they differ greatly: a proportion of 0.5 has odds of 1, and a proportion of 0.9 has odds of 9.
Choosing the right measure
Use risk when you follow a fixed group for a fixed period and nobody drops out: it is easy to interpret, for example "5 percent of vaccinated people got the disease". Use rate when people are observed for different lengths of time or when the population is open. Use prevalence to describe the burden of a condition now. Use odds where the design requires it. Ask yourself in each case: What is the numerator? What is the denominator? What is the time?
Common misconceptions
"A rate is any fraction." A rate needs time in its denominator. Many "rates" in older terminology are proportions, so read definitions carefully.
"Risk and rate are the same." Risk is a probability over a period (between 0 and 1); a rate is events per person-time and can exceed 1.
"Odds of 0.2 mean a 20 percent chance." Odds of 0.2 mean a probability of 0.2 / 1.2 = 0.167, about 17 percent. Odds and probability are close only for rare events.
"Per 100,000 means 100,000 people were studied." It is only a scaling convention; the actual population can be much smaller or larger.
Try it
Press Run (or Ctrl + Enter) to see the result here.
Program input · what you'd type while the program runs
Type the answers before you press Run, one per line. Each time the program reads a line (with input()), it gets the next line from this box.
Press Run (or Ctrl + Enter) to see the result here.
Program input · what you'd type while the program runs
Type the answers before you press Run, one per line. Each time the program reads a line (with input()), it gets the next line from this box.
Check your understanding
Quick check · 5 questions
of 5 answered You scored / 5 · perfect!
-
1. In a town of 4,000 people, 80 get influenza in a season. What is the proportion ill, in percent?
80 / 4,000 = 0.02, which is 2 percent. -
2. A cohort accumulates 4 events over 200 person-years. The incidence rate is
4 / 200 = 0.02 per person-year, or 2 per 100 person-years. -
3. Which measure is really a proportion despite its name?
Case fatality is the proportion of cases who die; it has no person-time in its denominator. -
4. Which statement about odds is correct?
Odds divide the chance an event happens by the chance it does not; for rare events 1 - p is almost 1. -
5. Why use person-time instead of the number of people as a denominator?
Person-time gives each person a weight proportional to the time they were actually at risk and observed.
Summary
- A ratio compares any two numbers; a proportion is part of a whole; a rate has person-time in the denominator.
- Incidence rate = new events / person-time at risk; it handles unequal follow-up and open populations.
- Several measures called "rates" (attack rate, case fatality rate) are proportions.
- Always state the multiplier and time period; odds = p / (1 - p) and approximate p for rare events.
Next: Incidence and prevalence
Track your progress
Create a free account to tick off lessons and pick up where you left off on any device.
of Public Health and Epidemiology lessons completed