


















Lesson 13 of 46 · Measuring Disease
Mortality and standardization: comparing death rates fairly
Learn crude, age-specific and cause-specific death rates, infant and maternal mortality, case fatality, and how direct and indirect standardization make comparisons fair.
Which country is healthier, one where the crude death rate is 6 per 1,000 per year or one where it is 11 per 1,000? The surprising answer is that the second could be the healthier country. Death rates depend on age, and a country with many older people will have a higher crude death rate even if its health care is excellent. To compare health fairly, epidemiologists adjust for age through standardization.
This lesson reviews the family of mortality measures (crude, age-specific, cause-specific, infant, maternal, case fatality), then explains direct and indirect standardization with a worked example in which the crude rates give the wrong ranking and the standardized rates give the right one.
What you will learn
- The common mortality measures and their denominators.
- Why crude rates mislead when age structures differ.
- How to compute an age-standardized rate (direct method) and a standardized mortality ratio (indirect method).
- What summary measures such as years of life lost and DALYs add.
Key terms
- Crude death rate: total deaths divided by the total population, per 1,000 per year.
- Age-specific rate: the death rate within one age group.
- Direct standardization: applying each population's age-specific rates to a common standard population.
- Standardized mortality ratio (SMR): observed deaths divided by the deaths expected if standard rates applied.
- Confounding by age: distortion of a comparison because the groups differ in age, which affects the outcome.
A family of mortality measures
Crude mortality rate: deaths in a year / mid-year population, usually per 1,000. It is simple and available everywhere, but it hides the age structure.
Age-specific mortality rate: the same, within an age group (for example, deaths of people aged 65 and over divided by the number of people aged 65 and over). Age-specific rates reveal the real risk at each age.
Cause-specific mortality rate: deaths from one cause divided by the whole population, often per 100,000.
Proportionate mortality: the share of all deaths due to a given cause. It is a proportion, not a rate: if heart disease causes 25 percent of deaths, this says nothing about how likely a person is to die of it, because it depends on all the other causes.
Infant mortality rate (IMR): deaths of children under one year of age per 1,000 live births in the same year. It is a sensitive indicator of a society's health, nutrition, sanitation and access to care. The neonatal mortality rate covers the first 28 days, and the under-five mortality rate covers children under five.
Maternal mortality ratio: deaths of women from pregnancy-related causes per 100,000 live births. It is called a "ratio" because the denominator (live births) is only a proxy for women at risk.
Case fatality: the proportion of people diagnosed with a disease who die of it, within a stated time. It describes the severity of the disease, not the risk in the population. During an epidemic, the case fatality can seem to change simply because the number of cases detected changes with the testing available.
Always check whether a figure is a rate (per person-time or per population-year), a ratio or a proportion, and always note the multiplier.
Why crude rates mislead
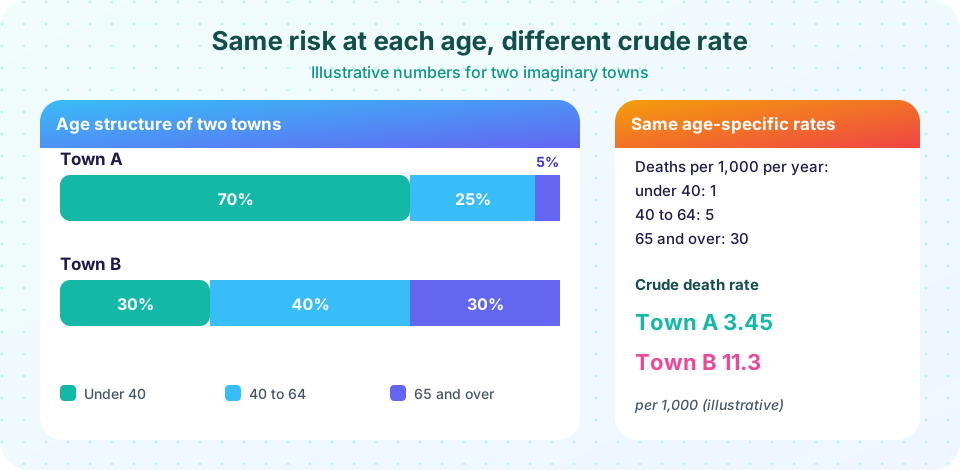
Age is the strongest predictor of death for adults. The risk of dying doubles roughly every eight years or so across most of adult life, a pattern known as the Gompertz law of mortality. So two populations with identical risk at every age but different age structures will have different crude rates. Compare two imaginary towns. Both have exactly the same age-specific death rates (per 1,000 per year): 1 for people under 40, 5 for ages 40 to 64, and 30 for people 65 and over. In Town A, 70 percent of residents are under 40, 25 percent are 40 to 64 and 5 percent are 65 or over. In Town B, the shares are 30, 40 and 30 percent.
Crude rate for Town A: 0.70 × 1 + 0.25 × 5 + 0.05 × 30 = 0.70 + 1.25 + 1.50 = 3.45 per 1,000. Crude rate for Town B: 0.30 × 1 + 0.40 × 5 + 0.30 × 30 = 0.30 + 2.00 + 9.00 = 11.3 per 1,000.
Town B's crude rate is more than three times higher, though nobody in Town B is at higher risk than a person of the same age in Town A. Age is a confounder: it is associated with the group (town) and with the outcome (death), and it distorts the comparison. The picture at the top of the lesson shows this.
Direct standardization
The cure is to compare the towns as if they had the same age structure. In direct standardization, you choose a standard population and apply each town's age-specific rates to it. Common standards include the WHO World Standard Population and the older Segi world population; countries and regions also use their own. For the example, suppose the standard has shares 50, 35 and 15 percent. Then:
age-standardized rate = sum over age groups of (standard share × age-specific rate)
For either town: 0.50 × 1 + 0.35 × 5 + 0.15 × 30 = 0.50 + 1.75 + 4.50 = 6.75 per 1,000. The two towns have identical standardized rates, correctly telling us that their health risk is the same. The numbers 6.75 describe neither town's actual death rate; they are artificial figures that exist only to compare. You can use any standard as long as you apply the same one to every population being compared, and the results can change with the standard chosen, so always report which one you used.
Direct standardization needs the age-specific rates of every population, and these can be unstable if the populations are small and some age groups have few deaths.
Indirect standardization and the SMR
If age-specific rates are not available, or are unstable for a small population, use indirect standardization. Instead of applying your population's rates to a standard population, you apply the standard population's rates to your population's age structure, to compute how many deaths you would expect:
SMR = observed deaths / expected deaths
An SMR of 1 means mortality equals the standard; above 1 means more deaths than expected; below 1 fewer. Multiplying by 100 gives the percentage form (an SMR of 80 means 20 percent fewer deaths than expected). For example, a town with 30,000 people under 40, 40,000 aged 40 to 64 and 30,000 aged 65 and over, whose standard rates are 1, 5 and 30 per 1,000, would expect 30 + 200 + 900 = 1,130 deaths. If 904 deaths are observed, the SMR is 904 / 1,130 = 0.80. Occupational and hospital studies often use SMRs because the workforce or patient group is small and the standard (a national population) is large and stable.
A caveat: SMRs of different populations are strictly comparable with the standard but not necessarily with each other, because each uses its own age structure as weights.
When ranking flips
The first demonstration shows how misleading crude rates can be. It adds a third town, D, which is as old as Town B but has lower age-specific rates, meaning it is genuinely healthier. Its crude rate (9.04) is much higher than Town A's (3.45), so a naive comparison says D is less healthy than A. But the standardized rates are 5.40 for D and 6.75 for A: D is healthier. The ranking flips. This reversal is a classic example of confounding, and a reminder that comparing crude figures without thinking about age can lead to the wrong decision about where to invest.
Beyond death rates: years of life lost and DALYs
Deaths are not equal: a death at age 5 costs more years than one at age 90. Years of life lost (YLL) counts the years a person would have lived given a reference life expectancy. Disability-adjusted life years (DALYs), used by the Global Burden of Disease studies, add the years lived with disability, weighted by severity: DALY = YLL + YLD (years lived with disability). One DALY is one lost year of healthy life. These summary measures let analysts compare the burden of a deadly but rare disease with that of a non-fatal but common one such as depression. Their weights and assumptions are debated, so treat them as informative summaries rather than exact truths.
Common misconceptions
"The country with the lower crude death rate is healthier." Not if age structures differ. Compare age-specific or age-standardized rates.
"A standardized rate is a real rate." It is a hypothetical figure for comparison; it depends on the chosen standard population.
"A case fatality of 2 percent means 2 percent of the population will die." Case fatality describes people who have the disease, not the whole population; the share who die also depends on how many get infected.
"Maternal mortality ratio and infant mortality rate use the same denominator." The maternal mortality ratio uses 100,000 live births; the infant mortality rate uses 1,000 live births.
Try it
Press Run (or Ctrl + Enter) to see the result here.
Program input · what you'd type while the program runs
Type the answers before you press Run, one per line. Each time the program reads a line (with input()), it gets the next line from this box.
Press Run (or Ctrl + Enter) to see the result here.
Program input · what you'd type while the program runs
Type the answers before you press Run, one per line. Each time the program reads a line (with input()), it gets the next line from this box.
Check your understanding
Quick check · 6 questions
of 6 answered You scored / 6 · perfect!
-
1. Why is the crude death rate of an older population higher even if its health care is excellent?
Age strongly raises the risk of death, so an older age structure raises the crude rate regardless of health care quality. -
2. In direct standardization, what do you apply to the standard population?
Each population's age-specific rates are weighted by a common standard population's age shares. -
3. A town has 120 observed deaths and 150 expected deaths at standard rates. What is the SMR?
SMR = observed / expected = 120 / 150 = 0.80, which means 20 percent fewer deaths than expected. -
4. What is proportionate mortality?
It is a proportion of deaths, not a rate of dying in the population. -
5. Which measure combines years of life lost and years lived with disability?
DALY = YLL + YLD, one year of healthy life lost. -
6. Two towns have identical age-specific rates. Town X has more older residents. Which statement is true?
Age structure affects the crude rate only; standardized rates remove its effect.
Summary
- Mortality measures include crude, age-specific, cause-specific, infant, maternal and case-fatality; check numerator, denominator and multiplier.
- Age confounds comparisons of crude rates, which can even reverse a ranking.
- Direct standardization applies each population's age-specific rates to a common standard; indirect standardization gives the SMR (observed / expected).
- Summary measures such as YLL and DALYs combine death and disability into one scale.
Next: Measures of association
Track your progress
Create a free account to tick off lessons and pick up where you left off on any device.
of Public Health and Epidemiology lessons completed