


















Lesson 42 of 46 · Projects and Practice
Project: A Case-Control Analysis with Confounding
Analyze a simulated case-control study step by step: crude odds ratio with confidence interval, stratification by age, Mantel-Haenszel adjustment, and an honest interpretation.
Case-control studies are the workhorse for rare diseases and for outbreaks in which the number of people at risk is unknown. You start with people who have the disease (cases) and a comparison group without it (controls), and ask how often each group had the exposure. The summary measure is the odds ratio.
In this project you analyze a small, invented case-control study of an illness linked to eating at a salad bar. The data contain a classic complication: age is related to both the exposure and the illness. You will compute the crude odds ratio, see how it changes after stratification, and write an interpretation that respects the limits of the data.
What you will learn
- Compute an odds ratio and its 95% confidence interval from a 2x2 table.
- Stratify by a confounder and compute the Mantel-Haenszel odds ratio.
- Compare crude and adjusted estimates and explain the difference.
- Describe the limits of case-control evidence.
Key terms
Odds: the ratio of the probability that something happens to the probability that it does not.
Odds ratio (OR): the odds of exposure in cases divided by the odds of exposure in controls (equal to the disease odds ratio).
Mantel-Haenszel OR: a weighted average of stratum-specific odds ratios.
Effect modification: when the exposure effect differs between strata.
Rare disease assumption: when disease is rare, the OR approximates the risk ratio.
The scenario and the data
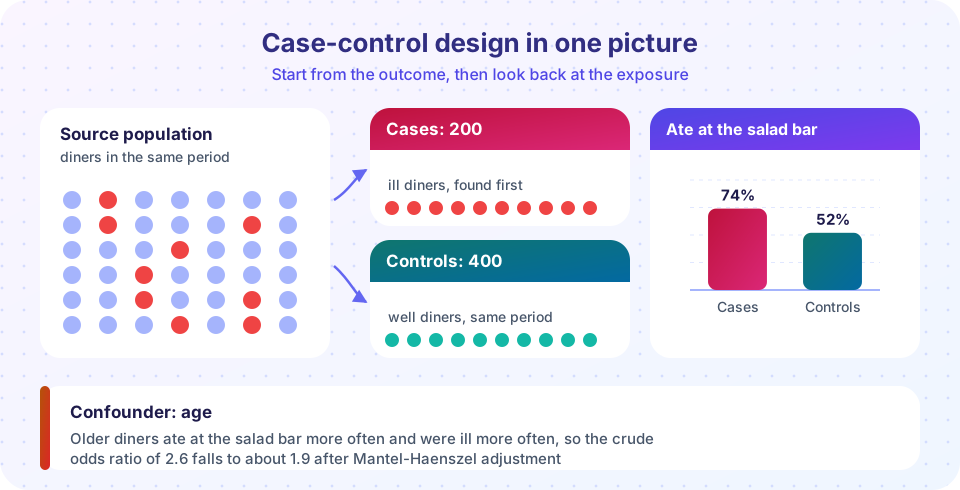
A local health department found a cluster of gastrointestinal illness and suspects a restaurant's salad bar. Because it cannot count all the diners at risk, it runs a case-control study: 200 cases and 400 controls (people who ate at the same restaurant during the same period but did not become ill). Everyone was asked whether they ate from the salad bar. The age group is also known (under 50 and 50 or older).
These counts are invented for the exercise:
| Age group | Group | Ate salad bar | Did not | Total |
|---|---|---|---|---|
| Under 50 | Cases | 36 | 24 | 60 |
| Under 50 | Controls | 96 | 144 | 240 |
| 50 or older | Cases | 112 | 28 | 140 |
| 50 or older | Controls | 112 | 48 | 160 |
Step 1: the crude odds ratio
Collapse the two age groups: cases 148 exposed and 52 unexposed; controls 208 exposed and 192 unexposed. The odds of exposure are 148 / 52 = 2.85 among cases and 208 / 192 = 1.08 among controls, so the crude OR = 2.85 / 1.08 = 2.63.
The usual formula for a 2x2 table with cells a (exposed cases), b (unexposed cases), c (exposed controls) and d (unexposed controls) is
OR = (a * d) / (b * c)
SE(ln OR) = sqrt(1/a + 1/b + 1/c + 1/d)
95% CI = exp( ln(OR) +/- 1.96 * SE )
You can verify each of these in the code below.
Press Run (or Ctrl + Enter) to see the result here.
Program input · what you'd type while the program runs
Type the answers before you press Run, one per line. Each time the program reads a line (with input()), it gets the next line from this box.
Step 2: stratify by age
Age is a candidate confounder only if it is associated with the exposure (among controls, who represent the source population) and with the disease. In this dataset:
- Older diners ate from the salad bar more often than younger diners (70% of older controls against 40% of younger controls).
- Older people are also over-represented among cases (140 of 200, or 70%, against 40% of controls, or 160 of 400), meaning age is related to the illness.
Because age is linked to both, the crude estimate mixes the effect of the salad bar with the effect of age. The stratum-specific odds ratios are 2.25 for those under 50 and about 1.71 for those aged 50 or older. The Mantel-Haenszel combined estimate lies between them, around 1.9. The crude OR of 2.63 is therefore larger than either stratum-specific estimate, a sign of positive confounding: age made the salad bar look more dangerous than it is.
Notice something else. The two stratum-specific ORs differ (2.25 and 1.71). With confidence intervals this wide, the difference could easily arise from chance, and a formal test of homogeneity would not reject the idea that the true OR is the same in both groups. If the ORs differed a lot, you would report them separately (effect modification), instead of pooling.
Step 3: look at precision and the role of chance
The adjusted estimate is about 1.9, and its confidence interval will still be wide. Draw the results and compare the intervals.
Press Run (or Ctrl + Enter) to see the result here.
Program input · what you'd type while the program runs
Type the answers before you press Run, one per line. Each time the program reads a line (with input()), it gets the next line from this box.
Step 4: interpret and report
A careful write-up might read:
The crude odds ratio for eating at the salad bar was 2.6 (95% CI about 1.8 to 3.8). After adjusting for age group using the Mantel-Haenszel method, the odds ratio was about 1.9 (95% CI about 1.3 to 2.9). Adjustment reduced the estimate, indicating positive confounding by age. The salad bar remains associated with illness after adjustment, which supports the hypothesis but does not prove it.
Add the limitations that apply to case-control evidence:
- Recall bias: cases may remember or report meals differently than controls.
- Control selection: controls came from the same restaurant visits, which may over-match on exposure; hospital or community controls would raise different problems.
- Residual confounding: only two age groups were used. Finer age categories, other foods and sex might matter.
- Odds ratio versus risk ratio: the OR approximates the RR only when the illness is rare among diners; with a high attack rate the OR would overstate the RR.
- No laboratory confirmation: the association needs microbiological support (isolating the organism from cases and from the suspected food).
Finally, list actions: inspect the salad bar, sample the ingredients and send stool samples from cases for testing, and communicate with the public.
Extension exercises
- Add a third stratum. Split the 50 or older group into 50 to 69 and 70 or older with plausible counts of your own. Does the Mantel-Haenszel estimate change much? What does that tell you about residual confounding by age within broad bands?
- Match the controls. Suppose each case was individually matched to two controls of the same age group. Explain why the matched design removes confounding by age from the design stage, and why the analysis must then use methods for matched sets (conditional logistic regression, or the Mantel-Haenszel method over matched sets).
- Test for homogeneity. Using the two stratum-specific log odds ratios and their standard errors, compute a z-statistic for the difference between them. Is there evidence of effect modification, or is the difference compatible with chance?
- Rare disease assumption. Suppose the illness affected 30% of diners. Why would the odds ratio overstate the relative risk? Work out an example with a 2x2 table where the risk is 30% in the exposed and 15% in the unexposed, and compare the OR with the RR.
- Rewrite the conclusion. Write two sentences for a news article that are faithful to the evidence: not too confident, and not dismissive.
Common misconceptions
"Adjusting always raises the odds ratio." Adjustment can move an estimate up, down or not at all, depending on the confounder.
"A case-control OR is a risk ratio." It equals the risk ratio only under the rare disease assumption.
"Matching or adjusting for age removes all confounding." Only confounding by the factors you handled and measured well.
Check your understanding
Quick check · 4 questions
of 4 answered You scored / 4 · perfect!
-
1. What is the crude odds ratio for cases 148 exposed / 52 unexposed and controls 208 exposed / 192 unexposed?
OR = (148 x 192) / (52 x 208) = 28,416 / 10,816 = 2.63. -
2. In this project the crude OR was larger than the adjusted OR. This indicates:
The confounder inflated the apparent association. -
3. When does the odds ratio approximate the risk ratio?
For rare outcomes the odds and the risk are almost equal. -
4. If stratum-specific odds ratios differed greatly (for example 1.1 and 6.0), what would be best practice?
A pooled summary can hide a real difference between groups.
Summary
- A case-control analysis computes an odds ratio and confidence interval from a 2x2 table.
- Stratifying by a confounder and pooling with Mantel-Haenszel gives an adjusted estimate.
- Comparing crude and adjusted odds ratios shows the size and direction of confounding.
- Limitations such as recall bias, control selection and residual confounding must be stated.
Next: Practice set
Track your progress
Create a free account to tick off lessons and pick up where you left off on any device.
of Public Health and Epidemiology lessons completed