


















Lesson 31 of 46 · Infectious Disease Epidemiology
Chapter Review: Infectious Disease Epidemiology
Review chapter 6 with a one-picture summary, recap table, worked formula sheet and a ten-question quiz covering the chain of infection, R0, SIR models, outbreaks and vaccines.
Infectious disease epidemiology rests on one idea that other fields of epidemiology do not need: cases create cases. From that idea follow the chain of infection, the reproduction number, the shape of epidemic curves and the logic of vaccination. This review ties them together and gives you a formula sheet you can use for exercises in chapter 9.
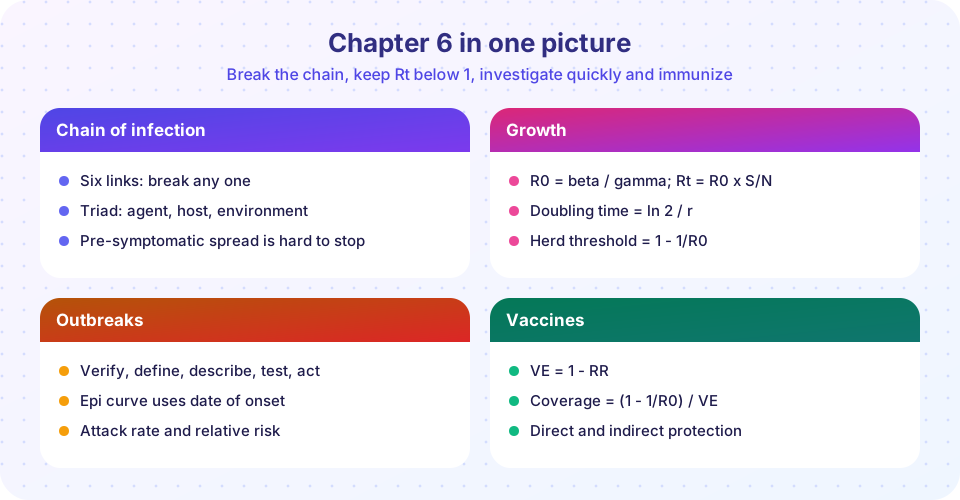
Recap table
| Topic | Key points |
|---|---|
| Triad and chain | Agent, host, environment; six links from agent to susceptible host; control measures break links. |
| Timing | Latent, incubation and infectious periods; serial interval; pre-symptomatic spread makes control harder. |
| R0 and Rt | R0 depends on pathogen, contacts and setting; Rt < 1 means decline. |
| SIR model | dS/dt, dI/dt, dR/dt with beta and gamma; R0 = beta / gamma; peak when S/N = 1/R0. |
| Herd immunity | Threshold 1 - 1/R0; coverage needed = threshold / efficacy; epidemics overshoot. |
| Outbreak investigation | Verify, define cases, describe by person-place-time, hypothesize, test, control, communicate. |
| Attack rate and RR | Compare attack rates in exposed and unexposed; check the share of cases explained. |
| Vaccines | Efficacy = 1 - RR; direct and indirect effects; safety monitoring in layers; eradication needs special features. |
Formula sheet
Doubling time          T_d = ln(2) / r
Approximate R0         R0 = 1 + r * T_g            (exponential generation interval)
SIR                    dS/dt = -beta S I / N ; dI/dt = beta S I / N - gamma I ; dR/dt = gamma I
Basic reproduction     R0 = beta / gamma
Effective reproduction Rt = R0 * S / N
Herd immunity          H = 1 - 1 / R0
Coverage needed        Vc = (1 - 1 / R0) / E
Peak infectious        I_max / N = 1 - (1 + ln R0) / R0      (start nearly fully susceptible)
Final size             z = 1 - exp(-R0 z)
Attack rate            AR = ill / exposed
Relative risk          RR = AR_exposed / AR_unexposed
Vaccine efficacy       VE = 1 - RR
Worked mini-example
A new infection has a mean infectious period of 5 days and R0 = 3. Then gamma = 1/5 = 0.2 per day and beta = R0 x gamma = 0.6 per day. The herd immunity threshold is 1 - 1/3 = 67%. If a vaccine is 90% effective, coverage of 0.667 / 0.9 = 74% is needed. At the epidemic peak, the susceptible fraction is 1/3.
The big ideas, revisited
Feedback explains almost everything. Because each case can create more cases, growth is exponential when Rt exceeds 1, and decline is exponential when it stays below 1. That is why a small difference in transmission, for instance a drop of R0 from 2.5 to 1.5, can change an epidemic from one that infects nine in ten people to one that infects about six in ten, and why the timing of interventions matters so much: a week of delay can mean several doublings.
Timing is the hidden variable. The incubation period, the serial interval and the generation time decide how fast an outbreak grows and how much time contact tracing has to work. A disease with short intervals gives little time; one with long intervals gives more. Pre-symptomatic transmission, which many infections show, makes symptom-based control weaker and pushes public health toward measures that do not depend on symptoms, such as vaccination, ventilation and testing.
Protection is collective. Vaccination protects the vaccinated person and, indirectly, the people who cannot be vaccinated. The threshold calculation tells you the target, but local coverage, waning immunity and who mixes with whom decide whether the target is enough. Detecting problems early depends on surveillance, and responding well depends on the investigation skills you practiced: describe by person, place and time, form a hypothesis, test it and act.
Three short cases
Case 1: a measles outbreak in a school. A school reports 92% coverage with two doses of measles vaccine, yet an outbreak occurs. Measles has an R0 of about 15, so the herd immunity threshold is 1 - 1/15 = 93.3%. A two-dose vaccine is about 97% effective, so 92% coverage gives about 0.92 x 0.97 = 89% of children immune, below the threshold. Overall coverage figures also hide pockets: if a group of families in one class declines vaccination, local coverage can be much lower than the school average, and the outbreak starts there. This is why public health programs aim for 95% or more and check coverage by local area, not just nationally.
Case 2: a gastroenteritis cluster at a conference. Forty delegates become ill within 36 hours of a buffet lunch. The epidemic curve shows a single peak about 12 hours after the meal. A single sharp peak suggests a point source, and the timing suggests an incubation period of about half a day. Attack rates by dish identify a salad, and a stratified analysis shows that a dressing eaten with the salad was not responsible by itself. Later, a second small wave appears two days afterward among family members of delegates, which signals secondary person-to-person spread: the outbreak has changed from a point-source to a propagated pattern. Control therefore needs both food safety and hygiene advice for households.
Case 3: a new respiratory virus. Early data suggest that people become infectious about two days before symptoms. The serial interval is about five days. If infected people are infectious before symptoms, isolating only people who feel ill will miss some transmission, so control also relies on tracing contacts, testing, ventilation and masks. The growth rate in the early phase is 0.12 per day, so the doubling time is ln 2 / 0.12 = 5.8 days. Using R0 = 1 + r x T_g with a generation time of about five days gives R0 close to 1.6, and the herd immunity threshold from that estimate would be about 38%. Remember that the estimate comes from rough assumptions about the generation time and that the real distribution of transmission is uneven, with some people infecting many others.
Traps that catch students in exams
- Confusing R0 and Rt. R0 is for a fully susceptible population without control measures; Rt changes over time.
- Using the formula for herd immunity without efficacy. Divide the threshold by the vaccine's effectiveness against infection or transmission.
- Treating a "95% effective" vaccine as leaving 5% of people unprotected. Efficacy is a relative risk reduction.
- Reading an epi curve by report date. Use date of onset.
- Judging a food by relative risk alone. Check the share of cases who ate it and confounding between foods.
- Saying epidemics end when everyone is infected. They end when Rt stays below 1, usually leaving many people uninfected.
Try it
The first demonstration is a formula checker. Enter R0 and vaccine efficacy and see the key numbers from this chapter in one place.
The second demonstration shows the nonlinear effect of reducing transmission: the final size of an epidemic against R0.
Press Run (or Ctrl + Enter) to see the result here.
Program input · what you'd type while the program runs
Type the answers before you press Run, one per line. Each time the program reads a line (with input()), it gets the next line from this box.
Check your understanding
Quick check · 10 questions
of 10 answered You scored / 10 · perfect!
-
1. Which link in the chain of infection is targeted by hand hygiene and sanitation for fecal-oral diseases?
They interrupt the route by which the agent travels from one person to another. -
2. For which of these is a pre-symptomatic infectious period a major problem for control?
Transmission before symptoms makes symptom-based isolation too late. -
3. In the SIR model with beta = 0.6 per day and gamma = 0.2 per day, R0 is:
R0 = beta / gamma = 0.6 / 0.2 = 3. -
4. Rt equals 1 when:
Rt = R0 x S/N, so Rt = 1 when S/N = 1/R0. -
5. A food has attack rate 30% among those who ate it and 3% among those who did not. RR is:
RR = 0.30 / 0.03 = 10. -
6. A single sharp epi curve over about one incubation period suggests:
One shared exposure produces one wave. -
7. Coverage needed for herd immunity with R0 = 6 and vaccine efficacy of 0.9 is closest to:
(1 - 1/6) / 0.9 = 0.833 / 0.9 = 0.926, about 93%. -
8. A vaccine reduces risk of disease from 2% to 0.4%. Its efficacy is:
RR = 0.4 / 2 = 0.2, so VE = 1 - 0.2 = 80%. -
9. Why did smallpox eradication succeed?
These features allowed surveillance and containment strategies to work. -
10. Which statement about epidemics and herd immunity is true?
The SIR model shows overshoot, since infectious people remain when Rt crosses 1.
Summary
- Infection spreads along a chain of six links; control means breaking one.
- R0, Rt, doubling time and the SIR model quantify growth and decline.
- Outbreak investigation follows a standard sequence and uses epi curves and attack rates.
- Vaccines act at individual and population levels, and coverage targets depend on R0 and efficacy.
- Next, chapter 7 turns to chronic disease, where causes accumulate over decades.
Track your progress
Create a free account to tick off lessons and pick up where you left off on any device.
of Public Health and Epidemiology lessons completed