


















Lesson 36 of 46 · Chronic Disease and Prevention
Chapter Review: Chronic Disease and Prevention
Review chapter 7 with a one-picture summary, a formula sheet and a ten-question quiz on NCDs, risk measures, PAF, DALYs, screening accuracy and Rose's prevention strategies.
Chronic disease epidemiology asks how many people are affected, what raises their risk, whether we can find disease early and how best to prevent it. This review gathers the chapter's tools into one picture and one formula sheet, then tests them with a longer quiz.
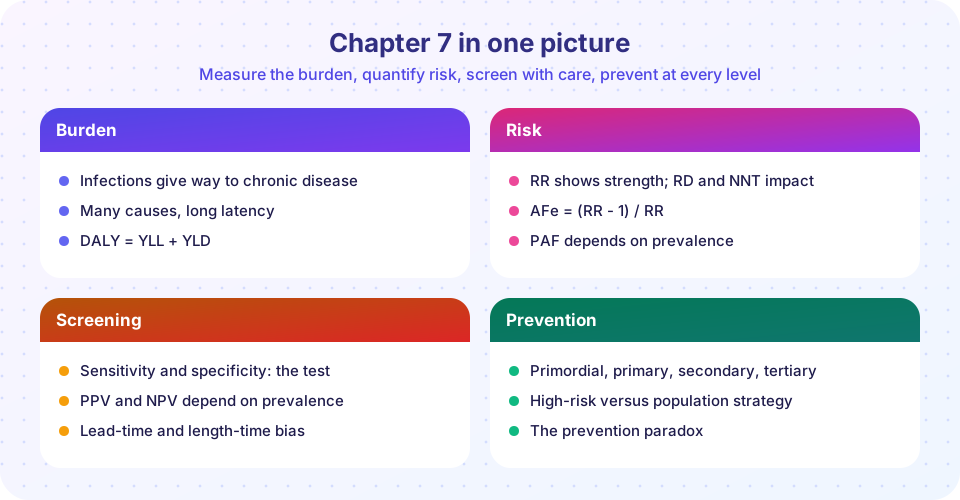
Recap table
| Topic | Key points |
|---|---|
| Epidemiologic transition | Leading causes shift from infection to chronic disease; many countries have a double burden. |
| Causation of NCDs | Multiple causes, long latency, continuous risk factors, life-course accumulation. |
| Relative and absolute risk | RR measures strength; risk difference and NNT measure absolute impact; baseline risk matters. |
| Attributable measures | AFe = (RR - 1)/RR; PAF = p(RR - 1)/(1 + p(RR - 1)); PAFs overlap. |
| DALY | Years of life lost plus years lived with disability. |
| Test accuracy | Sensitivity and specificity belong to the test; PPV and NPV depend on prevalence. |
| Screening biases | Lead-time, length-time, overdiagnosis, healthy volunteer effect. |
| Prevention | Primordial, primary, secondary, tertiary; Rose's high-risk and population strategies; prevention paradox. |
Formula sheet
RR   = risk(exposed) / risk(unexposed)
RD   = risk(exposed) - risk(unexposed)
AFe  = (RR - 1) / RR
PAF  = p (RR - 1) / (1 + p (RR - 1))
ARR  = risk(control) - risk(treated)        NNT = 1 / ARR
DALY = YLL + YLD
Sens = TP / (TP + FN)       Spec = TN / (TN + FP)
PPV  = TP / (TP + FP)       NPV  = TN / (TN + FN)
LR+  = Sens / (1 - Spec)    post-test odds = pre-test odds x LR+
A worked mixed example
A screening program targets a disease with 2% prevalence in 5,000 people. The test has sensitivity 80% and specificity 90%.
- Diseased: 100. Healthy: 4,900.
- TP = 80, FN = 20. FP = 4,900 x 0.10 = 490, TN = 4,410.
- PPV = 80 / (80 + 490) = 14%. NPV = 4,410 / (4,410 + 20) = 99.5%.
- LR+ = 0.8 / 0.1 = 8. Pre-test odds 2/98 = 0.0204; post-test odds 0.163; probability 0.163 / 1.163 = 14%, which matches the PPV.
The big ideas, revisited
Three threads run through the whole chapter, and you can use them to organize your revision.
Numbers need context. A relative risk, a percentage of cases, a test result and a DALY total all depend on a denominator that is easy to forget. The relative risk needs the baseline risk to become an absolute effect. The PAF needs the prevalence of exposure. The PPV needs the prevalence of disease. The DALY total needs the size of the population. Whenever you meet a number, ask what it is a fraction of, and for whom.
Who is counted shapes what is found. Screening studies, risk-factor cohorts and burden estimates are all vulnerable to selection and measurement problems: healthy volunteers, people who drop out, diagnoses that depend on who is tested. The same problem appears in different clothes in each lesson, which is why the habits of chapter 5 apply here.
Prevention is about distributions, not just individuals. The most useful insight from Rose is that a risk factor is a property of a population as well as of a person. Blood pressure, body weight and smoking are distributed across everyone; shifting the distribution changes the number of cases even if each person changes only slightly. This reframes the question from "who is at high risk?" to "why does this population have the distribution it has, and what shapes it?" That question leads directly to the next chapter on social conditions and policy.
Three integrated cases
Case 1: should a region start a screening program? A health authority considers screening 100,000 adults for a cancer with a prevalence of 0.3% in the screened age group. The test has a sensitivity of 85% and a specificity of 96%. The expected results: 300 people have the cancer, 255 are detected and 45 are missed; among the 99,700 without the cancer, 3,988 receive a false-positive result. The positive predictive value is 255 / (255 + 3,988) = 6%, so about 16 of every 17 positive results are false alarms and need follow-up tests, with their costs and anxiety. Whether the program is worthwhile depends on evidence that early treatment improves outcomes (randomized trials with cancer mortality as the outcome), on the harms of follow-up procedures and overdiagnosis, and on cost per QALY. A strong test is not enough on its own.
Case 2: which risk factor deserves the policy priority? Suppose factor A has a relative risk of 6 and is present in 1% of the population, while factor B has a relative risk of 1.5 and is present in 40%. The population attributable fraction of A is 0.01 x 5 / (1 + 0.05) = 4.8%. For B it is 0.4 x 0.5 / (1 + 0.2) = 16.7%. The weaker but much more common factor accounts for more disease, which is the reasoning behind Rose's population strategy. It does not mean that A should be ignored: the individuals with A have a very high risk and benefit from targeted help, so a sensible program combines both strategies.
Case 3: reading a headline. A news story says that a food "raises the risk of heart disease by 40%". Questions to ask: what is the baseline risk (if it is 1% over ten years, a 40% relative increase is 1.4%, an extra 4 cases per 1,000 people); was the result adjusted for smoking, age and other confounders; was it from an observational study with possible healthy-user bias; and has it been replicated? These questions turn a headline into an evaluation.
Traps that catch students in exams
- Mixing up sensitivity and PPV. Sensitivity starts from people with the disease; PPV starts from people with a positive test.
- Ignoring prevalence when interpreting a test. The same test gives different predictive values in different populations.
- Adding PAFs for several factors. They overlap and can exceed 100%.
- Reporting only relative risks. Always convert to absolute numbers when explaining risk to others.
- Calling screening successful because survival from diagnosis increased. Compare mortality in randomized groups.
- Forgetting the denominator in DALYs. DALYs are totals; compare rates per 100,000 when populations differ in size.
Try it
The first demonstration is an all-in-one 2x2 table tool that computes both risk and test-accuracy measures. Use the sample numbers or enter your own.
The second demonstration compares how much a treatment helps people at different baseline risks, a quick reminder that NNT depends on who you treat.
Press Run (or Ctrl + Enter) to see the result here.
Program input · what you'd type while the program runs
Type the answers before you press Run, one per line. Each time the program reads a line (with input()), it gets the next line from this box.
Check your understanding
Quick check · 10 questions
of 10 answered You scored / 10 · perfect!
-
1. Risk is 30 per 1,000 in exposed and 10 per 1,000 in unexposed. What is the attributable fraction among the exposed?
RR = 3, so AFe = (3 - 1)/3 = 0.67. -
2. Which statement best describes DALYs?
DALY = YLL + YLD. -
3. A test has sensitivity 95% and specificity 90%. In a population with 0.5% prevalence, PPV is likely to be:
With rare disease most positives are false: PPV = 0.00475/(0.00475 + 0.09950) is about 4.6%. -
4. Which of these is secondary prevention?
Screening aims to detect disease early. -
5. An absolute risk reduction of 0.5 percentage points gives an NNT of:
NNT = 1/0.005 = 200. -
6. What is the prevention paradox?
Rose's paradox explains why population strategies can be unpopular despite large overall effects. -
7. A screening program reports longer 5-year survival after diagnosis. The most important bias to rule out is:
Earlier diagnosis inflates survival from diagnosis even if death occurs at the same time. -
8. Which factor most strongly increases the population attributable fraction, other things equal?
PAF depends on both the relative risk and the proportion exposed. -
9. The epidemiologic transition describes:
As societies develop, chronic diseases replace infections as leading causes of death. -
10. Which is an example of a population strategy?
Reformulating food shifts the distribution of intake in the whole population.
Summary
- Risk measures answer different questions: strength (RR), excess (RD), share among exposed (AFe), share in the population (PAF) and treatment effort (NNT).
- Test accuracy and predictive value are different things; prevalence connects them.
- Screening claims need randomized evidence because of lead-time, length-time and overdiagnosis biases.
- Prevention works at four levels and with two broad strategies; most cases come from moderate-risk majorities.
- Next, chapter 8 looks at the systems, social conditions and policies that shape population health.
Track your progress
Create a free account to tick off lessons and pick up where you left off on any device.
of Public Health and Epidemiology lessons completed