


















Lesson 15 of 46 · Measuring Disease
Chapter 3 review: measuring disease
Review chapter 3: ratios, proportions, rates, incidence, prevalence, standardization and measures of association, with a recap table, a toolkit demo and a ten-question quiz.
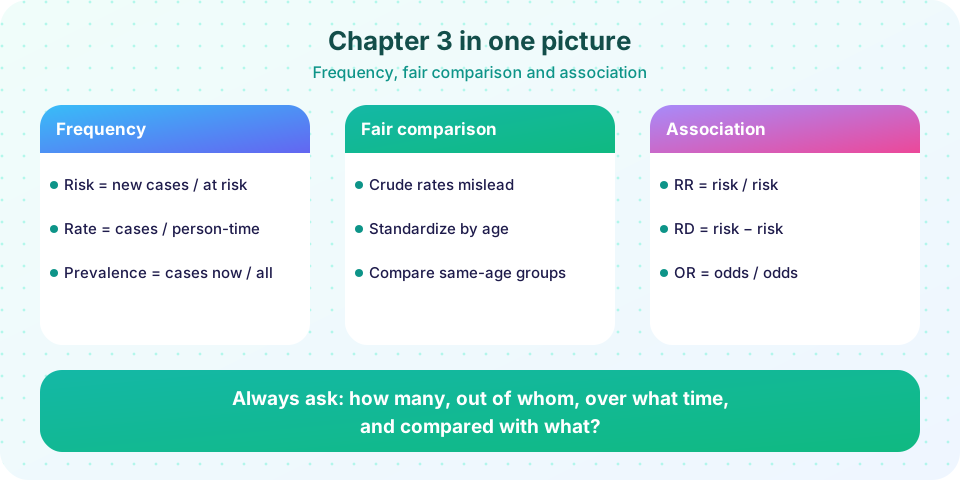
You now have the arithmetic of epidemiology. You can say how common a disease is (incidence and prevalence), compare populations fairly (standardization) and quantify the link between an exposure and an outcome (risk ratio, risk difference, odds ratio). This review ties the tools together and checks that you can choose the right one for a given question.
What you will learn
- A recap of every measure in chapter 3 and its formula.
- How to choose among measures for common questions.
- How well you remember them, through a ten-question quiz.
Chapter in one table
| Measure | Formula | Best used for |
|---|---|---|
| Ratio | a / b | Comparing two numbers, such as sex ratio |
| Proportion | part / whole | Shares, prevalence, attack rate, case fatality |
| Cumulative incidence (risk) | new cases / people at risk at start | Closed cohorts, fixed periods |
| Incidence rate | new cases / person-time | Open populations, unequal follow-up |
| Prevalence | existing cases / population | Burden, planning |
| P ≈ I × D | incidence times duration | Linking incidence and prevalence |
| Crude death rate | deaths / mid-year population | Quick overview (age-blind) |
| Direct age-standardized rate | sum of standard share × age-specific rate | Comparing populations |
| SMR | observed / expected deaths | Small groups, workforces |
| Risk ratio | risk exposed / risk unexposed | Strength of association |
| Risk difference | risk exposed − risk unexposed | Impact, NNT = 1 / RD |
| Odds ratio | (a × d) / (b × c) | Case-control studies, logistic regression |
| Vaccine efficacy | (1 − RR) × 100 | Protective exposures |
| Attributable fraction (exposed) | (RR − 1) / RR | Share of exposed cases due to exposure |
Choosing the right measure
- "What share of the town has diabetes today?" Prevalence.
- "What is the chance that a healthy 50-year-old develops it within ten years?" Cumulative incidence (risk).
- "Compare cancer death between two countries with very different ages." Age-standardized rates.
- "Is hospital X's death rate higher than expected for its patient mix?" SMR.
- "How much more likely are smokers to develop the disease?" Risk ratio (cohort) or odds ratio (case-control).
- "How many extra cases will the exposure cause per 1,000 people?" Risk difference.
Practice problems with answers
- A cohort accumulates 25 events in 500 person-years. What is the incidence rate per 1,000 person-years? Answer: 25 / 500 = 0.05 per person-year, or 50 per 1,000 person-years.
- A disease has an incidence of 100 per 100,000 per year and an average duration of 5 years. What is the approximate prevalence? Answer: 100 x 5 = 500 per 100,000, or 0.5 percent.
- A table gives a = 15, b = 85, c = 5, d = 95. Compute RR, RD, OR and the number needed to harm. Answer: risks are 0.15 and 0.05, so RR = 3.0 and RD = 0.10; OR = (15 x 95) / (85 x 5) = 1,425 / 425, about 3.35; NNH = 1 / 0.10 = 10.
- A factory has 45 deaths where 36 were expected from national rates. What is the SMR? Answer: 45 / 36 = 1.25, which is 25 percent more deaths than expected.
Pitfalls to remember
- Reporting counts without denominators.
- Calling a proportion a rate, or forgetting the multiplier (per 1,000 or per 100,000).
- Comparing crude rates of populations with different age structures.
- Reading an odds ratio as a risk ratio when the outcome is common.
- Quoting only a relative measure when the absolute risk is tiny.
Try it
Press Run (or Ctrl + Enter) to see the result here.
Program input · what you'd type while the program runs
Type the answers before you press Run, one per line. Each time the program reads a line (with input()), it gets the next line from this box.
Check your understanding
Quick check · 10 questions
of 10 answered You scored / 10 · perfect!
-
1. A rate differs from a proportion because a rate
A rate is events per unit of person-time; a proportion has no time in the denominator and lies between 0 and 1. -
2. A disease has an incidence of 300 per 100,000 per year and an average duration of 2 years. The prevalence is about
P is approximately I x D = 300 x 2 = 600 per 100,000. -
3. Why can a country with excellent health care have a high crude death rate?
Older populations have more deaths at the same age-specific risk, so crude rates rise. -
4. A hospital observes 90 deaths where 120 were expected. The SMR is
90 / 120 = 0.75, 25 percent fewer deaths than expected. -
5. In a table with a = 20, b = 80, c = 10, d = 90, the risk ratio is
Risk exposed 20/100 = 0.20; unexposed 10/100 = 0.10; RR = 2.0. -
6. In the same table the odds ratio is
OR = (20 x 90) / (80 x 10) = 1,800 / 800 = 2.25, larger than the RR because the disease is not rare. -
7. A vaccine trial gives a risk ratio of 0.40. Vaccine efficacy is
VE = (1 - 0.40) x 100 = 60 percent. -
8. Which measure best suits a case-control study?
Because the investigator fixes the number of cases and controls, risks cannot be computed, but the odds ratio can. -
9. An absolute risk reduction of 0.02 gives a number needed to treat of
NNT = 1 / 0.02 = 50. -
10. Which is the best reason to report both relative and absolute measures?
A doubled very rare risk is still very rare; the absolute difference conveys impact.
Summary
- Choose the measure by the question: frequency (risk, rate, prevalence), fair comparison (standardization) or association (RR, RD, OR).
- Link incidence and prevalence with P ≈ I × D, and compare populations after adjusting for age.
- Report relative and absolute measures together, with confidence intervals.
- Always ask: how many, out of whom, over what time, and compared with what?
Track your progress
Create a free account to tick off lessons and pick up where you left off on any device.
of Public Health and Epidemiology lessons completed