


















Lesson 29 of 46 · Infectious Disease Epidemiology
Outbreak Investigation: From John Snow to Today
Follow the steps of an outbreak investigation: John Snow's cholera work, case definitions, epidemic curves, attack rates and relative risk, with a food-poisoning simulation.
When several people fall ill in the same place at the same time, a health department has to answer three questions quickly: what is it, where is it coming from, and how do we stop it? Outbreak investigation is the applied side of epidemiology, and it works like detective work with numbers. The first big success of the method came in London in 1854, long before anyone had seen a cholera bacterium.
This lesson shows how investigators work: the standard steps, the three descriptive questions (person, place, time), the shape of an epidemic curve, and the arithmetic of attack rates and relative risk that points to a source.
What you will learn
- Describe John Snow's 1854 investigation and why it matters.
- List the main steps of an outbreak investigation.
- Write a case definition and use it to find cases.
- Read an epidemic curve and tell point-source from propagated outbreaks.
- Compute attack rates and relative risk to identify a source.
Key terms
Outbreak: more cases of a disease than expected in a place and time (often used for a small localized epidemic).
Case definition: a standard set of criteria (clinical, person, place, time, laboratory) for counting someone as a case.
Epidemic curve (epi curve): a histogram of the number of new cases by time of symptom onset.
Attack rate: the proportion of a group that becomes ill during an outbreak.
Index case: the first case that comes to attention; the primary case is the one that brought the infection into the group.
John Snow and the Broad Street pump
In August and September 1854, cholera struck the Soho district of London and more than 600 people in the area died within weeks. At the time, most physicians believed in the "miasma" theory: that disease spread through foul air. John Snow, an anesthetist and physician, suspected contaminated water instead. He had already proposed this idea in 1849, when he noted that cholera attacked the gut, and that people appeared to swallow whatever caused it.
Snow mapped the deaths and found that they clustered around the public water pump on Broad Street. He also followed up exceptions, which is how good detective work proceeds. A workhouse nearby, with its own well, had very few deaths. A brewery's workers, who drank beer, also did relatively well. A woman who lived far from Soho but liked the taste of the Broad Street water had it delivered to her home, and she died. Snow presented his findings to local officials and the handle was removed from the pump. By then the outbreak was already declining, so the removal's effect cannot be cleanly measured, a good example of how hard it is to separate intervention from natural course.
His broader study of London compared households supplied by two water companies, one drawing water from a sewage-polluted stretch of the Thames and the other from a cleaner upstream point. Deaths from cholera were many times higher in households supplied by the polluted source. It is often called a "natural experiment" and is a model of the cohort-style comparison of attack rates you will see below. Vibrio cholerae, the bacterium, was identified by Filippo Pacini in 1854 and, independently and more famously, by Robert Koch in 1883. Snow never knew the microbe, and still got the route of transmission right.
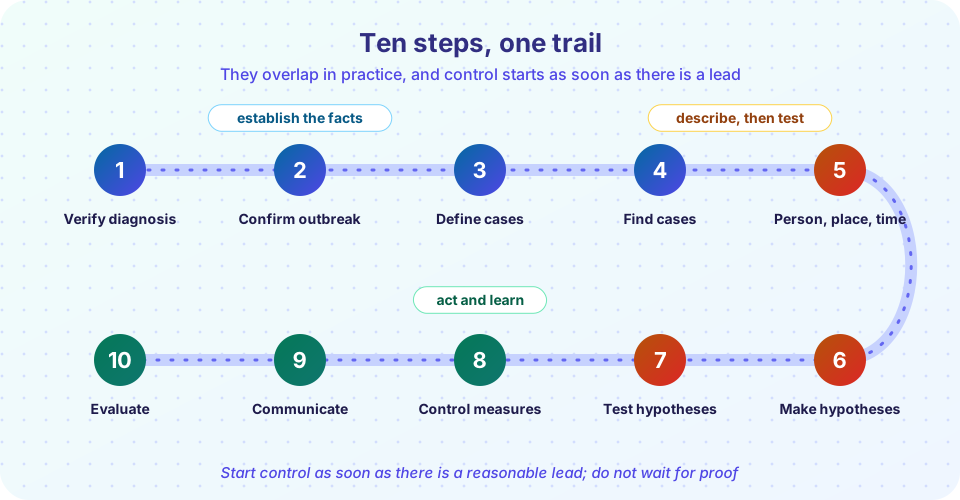
The steps of an outbreak investigation
Textbooks list slightly different steps, but they tend to look like this:
- Prepare and establish the team, roles and laboratory support.
- Verify the diagnosis: confirm that the illness is what it seems (laboratory tests, clinical review).
- Confirm that there is an outbreak: compare current case counts with the expected baseline.
- Define cases and find cases (ask clinicians, laboratories and the public; build a line list).
- Describe the outbreak by time (epi curve), place (map) and person (age, sex, exposures).
- Develop hypotheses about the source and mode of transmission, interviewing cases openly.
- Test the hypotheses with a cohort or case-control study and, if needed, environmental and laboratory work.
- Implement control measures: begin as soon as you have a reasonable lead, do not wait for proof.
- Communicate results to the public, clinicians and officials.
- Evaluate and write up what was learned.
In real investigations these steps overlap. Control measures often begin before step 7 completes, and new findings send the team back to earlier steps.
Case definitions
A good case definition is explicit and standard. For example: "Any person who attended the club dinner on 12 June and developed diarrhea (three or more loose stools in 24 hours) between 12 and 15 June." Investigators often use tiers:
- Confirmed: laboratory-proven.
- Probable: clinical picture plus an epidemiologic link.
- Possible: clinical picture only.
A broad (sensitive) definition catches more true cases at the start, which helps find the source; a narrow (specific) definition is better for analysis, when you want to avoid including unrelated illness.
Reading an epidemic curve
An epi curve plots cases by time of onset (not report). Its shape provides clues.
- Point-source outbreak: everyone is exposed at about the same time, for example at one meal. The curve rises and falls steeply within a single incubation period. The width of the curve reflects the spread of incubation periods, and the time from the peak to the exposure often approximates the median incubation period.
- Continuous (common-source) outbreak: exposure continues, for example a contaminated water supply. The curve rises, then plateaus until the source is removed.
- Propagated (person-to-person) outbreak: cases infect others, so successive waves appear, spaced roughly one serial interval apart, usually growing at first.
Attack rates and relative risk
Suppose a group of people shared a meal, and some became ill. For each food item, compare attack rates among those who ate it with those who did not.
Attack rate (ate)      = ill who ate / total who ate
Attack rate (did not)  = ill who did not eat / total who did not eat
Relative risk (RR)     = attack rate (ate) / attack rate (did not)
A food with a high RR and with most of the ill people having eaten it is the prime suspect. If nearly everyone ate a certain dish, the RR cannot be large, so also check what percent of cases ate each item, because the culprit should explain most cases. The 95% confidence interval of a relative risk is commonly computed on the log scale: exp(ln(RR) +/- 1.96 x SE) where SE = sqrt(1/a - 1/(a+b) + 1/c - 1/(c+d)).
When the number of people at risk is not clear (a restaurant with unknown total customers), investigators use a case-control study and report odds ratios instead; chapter 4 explains why this works.
Common misconceptions
"The largest RR identifies the source." A rare food eaten by two people can give a huge but imprecise RR. Check confidence intervals and the proportion of cases explained.
"We must find the cause before acting." Control measures should begin once there is a plausible lead. The 1854 pump handle is a symbol of acting on partial evidence.
"An epi curve plots the date people reported illness." It plots onset dates, which are closer to the time of infection.
Try it
First, an attack-rate calculator. Enter the counts for one food item and get attack rates, relative risk and a confidence interval. The default values come from the invented outbreak simulated in the next demonstration.
Second, a simulated food-poisoning outbreak at a gathering of 120 people. The simulation invents a contaminated chicken salad, builds a line list, draws the epi curve and ranks the foods by relative risk, just as an investigator would.
Press Run (or Ctrl + Enter) to see the result here.
Program input · what you'd type while the program runs
Type the answers before you press Run, one per line. Each time the program reads a line (with input()), it gets the next line from this box.
Check your understanding
Quick check · 4 questions
of 4 answered You scored / 4 · perfect!
-
1. What did John Snow's investigation of the 1854 cholera outbreak chiefly demonstrate?
Snow reasoned from patterns, before the microbe was known. The outbreak was already declining when the handle was removed. -
2. An epi curve shows one sharp peak lasting about one incubation period. This suggests:
A single exposure gives one rise and fall whose width reflects the range of incubation periods. -
3. A food has 20 ill among 40 who ate it and 5 ill among 80 who did not. What is the relative risk?
Attack rates are 20/40 = 0.50 and 5/80 = 0.0625, so RR = 0.50 / 0.0625 = 8. -
4. Why might investigators begin with a broad case definition?
Early in an investigation missing cases is the larger risk. The definition can be tightened for analysis.
Summary
- Snow's work shows that careful description and comparison can identify the source of an outbreak before the agent is known.
- An investigation moves from verifying the diagnosis to describing person, place and time, testing hypotheses and acting.
- Epi curves distinguish point-source, continuous and propagated outbreaks.
- Attack rates and relative risks rank suspect exposures, and the share of cases explained is a check on them.
Track your progress
Create a free account to tick off lessons and pick up where you left off on any device.
of Public Health and Epidemiology lessons completed