


















Lesson 17 of 46 · Study Designs
Descriptive studies: case reports, surveys, outbreaks and ecological studies
Learn case reports, case series, cross-sectional surveys and ecological studies, how to read an epidemic curve and attack rates, and why group-level patterns can mislead individuals.
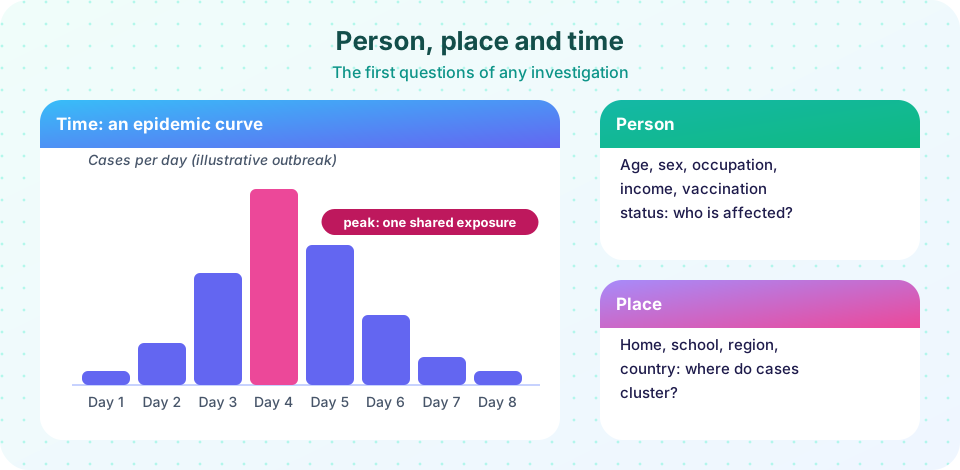
Every investigation begins with description. Before anyone can test whether a factor causes a disease, someone has to notice that the disease is unusual: a doctor sees a strange cluster of patients, a survey finds that an illness is common in some places, a graph shows an outbreak starting on a certain day. Descriptive studies characterize the occurrence of disease by person, place and time. They are quick and cheap, often the first signal of a new problem, and they produce the hypotheses that analytic studies later test.
This lesson covers four descriptive designs (case reports and series, cross-sectional surveys, ecological studies), shows how an outbreak team uses attack rates and an epidemic curve to point to a source, and explains why the apparent link between groups does not always hold for individuals.
What you will learn
- The four main descriptive designs and what each can and cannot show.
- How to compute food-specific attack rates and a risk ratio in an outbreak.
- How to read an epidemic curve.
- What the ecological fallacy is and why it happens.
Key terms
- Case report / case series: a detailed description of one patient, or of a group of patients with a similar condition.
- Cross-sectional study: a survey that measures exposure and outcome in a population at one point in time.
- Ecological study: a study in which the units of analysis are groups, such as countries or regions.
- Attack rate: the proportion of an exposed group who become ill during an outbreak.
- Ecological fallacy: wrongly assuming that a relationship observed between groups holds for the individuals in them.
Case reports and case series
A case report describes an unusual patient or event in detail; a case series describes several patients with the same condition. They have no comparison group, so they cannot show that an exposure causes anything, but history is full of signals that began this way. In 1961, an obstetrician in Australia and a pediatrician in Germany independently noticed that babies born with severe limb defects had mothers who had taken the sedative thalidomide in pregnancy. In June 1981, a short report in the US weekly report of the CDC described five previously healthy young men in Los Angeles with a rare pneumonia, an early sign of what became known as AIDS. Both reports caught attention because the condition was rare and the pattern was striking.
Their strengths: speed, detail and the ability to spot something new. Their weaknesses: no denominator, no comparison and the risk of reading too much into a coincidence. A case series is a call to investigate, not a conclusion.
Cross-sectional studies
A cross-sectional study (a survey or prevalence study) measures the exposure and the disease in a sample at the same time, like a snapshot. Examples include national health surveys, such as the US National Health and Nutrition Examination Survey, or the Demographic and Health Surveys conducted in many low- and middle-income countries. These give prevalence estimates and can compare prevalence between groups: the prevalence of hypertension among people with and without obesity, for instance.
Cross-sectional studies are relatively cheap and useful for planning services. Their main weakness is the problem of temporality: because exposure and outcome are measured together, you cannot tell which came first. Do depressed people become unemployed, or does unemployment cause depression? In addition, prevalence is influenced by duration, so a risk factor that lengthens disease may look like a cause (the bathtub again). People who died of the disease or recovered are missing from the snapshot, which produces survivor bias.
Ecological studies
In an ecological study, the unit of analysis is a group: country, region, school or time period. Data are routine and cheap: average salt intake of each country versus national stroke rates, air pollution by city versus asthma admissions, vaccination coverage by district versus measles incidence. They are good for generating hypotheses and for exposures that are naturally group-level, such as a law or a water supply.
Their classic weakness is the ecological fallacy, named by sociologist William Robinson in 1950: associations seen between groups need not hold within individuals. The reason is that groups differ in many other ways, and we do not know which individuals within a group were exposed and which became ill. In the second demonstration below, six regions each have a different baseline risk, caused by some hidden factor, and regions with higher exposure also have a higher baseline risk. Across regions, exposure and disease are perfectly correlated, yet within every region exposed people have exactly the same risk as the unexposed, so the exposure does nothing. A researcher who looked only at regional averages would wrongly conclude that the exposure raises risk. The opposite can happen too: a real individual-level effect can disappear in group data.
Investigating an outbreak: a worked example
Outbreak investigation combines descriptive steps with a first analytic comparison. Suppose 28 of 60 people who attended a community potluck develop vomiting and diarrhea. The team takes a line list (one row per person with age, symptoms, onset time and foods eaten) and works through three questions.
When? They plot the epidemic curve, the number of new cases against time of onset. Here, cases begin about 4 hours after the meal, peak around 16 to 19 hours and trail off within a day and a half. A single sharp peak is typical of a point-source outbreak, where everyone was exposed at about the same time, and the time from exposure to peak shows the typical incubation period. If instead the curve had waves spaced one incubation period apart, person-to-person spread would be likely.
Who and where? All cases attended the same event, and ill people were of all ages, so a shared food or drink is plausible.
What? For each food the team compares the attack rate among those who ate it with the attack rate among those who did not. For chicken salad, 24 of 30 people who ate it became ill (80 percent) against 4 of 30 who did not (about 13 percent): the risk ratio is 6.0. For coleslaw the attack rates are 47 and 46 percent (RR about 1.0), and for lemonade 54 and 41 percent (RR 1.3). The chicken salad stands out. This is the first demonstration. The table does not prove that the salad was contaminated, since it is possible that some other factor links salad and illness, but it focuses the laboratory work on the right food and, combined with a plausible organism and food-handling errors, identifies the cause.
This is a small taste of an analytic comparison inside a descriptive investigation; real teams would also compute confidence intervals and test samples. Notice that the RR is exactly the measure of association from the previous lesson.
When to use descriptive studies
Use them to detect new problems, to estimate how common a condition is, to plan services, to generate hypotheses, and to track trends. Do not use them alone to claim causation. A useful rule: descriptive studies tell you what to look into; analytic studies tell you what is probably true.
Common misconceptions
"A case series proves the exposure caused the disease." It cannot, because it has no comparison group. It is a signal for further study.
"If countries with more of X have more of Y, then X causes Y in people." That is the ecological fallacy. Individual-level data are needed to know whether the same people who have X have Y.
"Cross-sectional surveys show what comes first." They do not; exposure and outcome are measured at the same time, so temporality is unknown.
"An outbreak with 28 cases means a large problem." Without a denominator you cannot tell. Compute attack rates.
Try it
Press Run (or Ctrl + Enter) to see the result here.
Program input · what you'd type while the program runs
Type the answers before you press Run, one per line. Each time the program reads a line (with input()), it gets the next line from this box.
Press Run (or Ctrl + Enter) to see the result here.
Program input · what you'd type while the program runs
Type the answers before you press Run, one per line. Each time the program reads a line (with input()), it gets the next line from this box.
Check your understanding
Quick check · 5 questions
of 5 answered You scored / 5 · perfect!
-
1. Which design measures exposure and outcome at the same time in a sample of people?
A cross-sectional study is a snapshot, so temporality cannot be established. -
2. In an outbreak, 24 of 30 people who ate dish X became ill and 4 of 30 who did not eat it became ill. What is the risk ratio?
Attack rate among eaters 24/30 = 0.80; among non-eaters 4/30 = 0.133; RR = 6.0. -
3. What is the ecological fallacy?
Group averages can hide different relationships within individuals, as when regional differences are driven by a third factor. -
4. An epidemic curve with a single sharp peak and a fall most suggests
Everyone was exposed at about the same time and developed illness within one incubation period. -
5. What is the main limitation of a case series?
Without a denominator and a comparison group, a case series cannot show that an exposure causes disease.
Summary
- Descriptive studies characterize disease by person, place and time and generate hypotheses.
- Case reports and series signal new problems; cross-sectional surveys give prevalence but not temporality; ecological studies use group data and risk the ecological fallacy.
- In an outbreak, the epidemic curve points to the type of spread and attack rates by food (or exposure) point to the source.
- Descriptive findings tell you what to investigate; analytic designs test causal hypotheses.
Next: Cohort studies
Track your progress
Create a free account to tick off lessons and pick up where you left off on any device.
of Public Health and Epidemiology lessons completed