


















Lesson 28 of 46 · Infectious Disease Epidemiology
R0 and SIR Models: How Epidemics Grow and Slow
Learn the basic reproduction number R0, the effective Rt, doubling time and the SIR model equations, with simulations of epidemic curves and the herd immunity threshold.
During an outbreak, the question everyone asks is "how fast is it growing, and will it stop?" Two ideas answer a large part of it: the reproduction number, which tells you whether each case leads to more or fewer cases, and the SIR model, a small set of equations that turns that idea into a full epidemic curve.
Mathematical models of infection began with Ronald Ross's work on malaria around 1900 and were put in the form used today by William Kermack and Anderson McKendrick in 1927. The SIR model is simple enough to run on your own computer and still captures behavior that surprised many people: why epidemics rise and then fall without everyone getting infected, why a small reduction in transmission can produce a large drop in cases, and why herd immunity has a threshold.
What you will learn
- Define R0 and the effective reproduction number Rt, and say what each depends on.
- Estimate growth from doubling time and the serial interval.
- Write down the SIR equations and explain each term.
- Compute the herd immunity threshold and the final size of an epidemic.
- State the model's assumptions and its limits.
Key terms
R0 (basic reproduction number): the average number of people one infectious case infects in a completely susceptible population with no control measures.
Rt (effective reproduction number): the average number of secondary cases per case at time t, given current immunity and measures.
Generation time: the time from infection of one person to infection of the people they infect.
Doubling time: the time for the number of new cases to double during exponential growth.
Herd immunity threshold: the immune fraction above which each case infects fewer than one person on average.
R0 and Rt
R0 depends on three things: how infectious the agent is per contact, how many contacts people have, and how long they remain infectious. In symbols, R0 is roughly transmission probability per contact x contact rate x infectious duration. That means R0 is not a fixed property of a pathogen. It describes a pathogen in a population, so it changes between crowded cities and sparse villages.
Rough published ranges illustrate the contrast. Measles is among the most infectious diseases, with R0 commonly quoted as 12-18. Seasonal influenza is typically around 1.3-1.5 (values depend on the season). Early estimates for the original SARS-CoV-2 strain were around 2-3, and later variants were estimated higher. Treat all of these as ballpark figures; every estimate has uncertainty and depends on the setting.
R0 describes the start. Rt changes as the epidemic proceeds, falling because of immunity (fewer susceptible people) and because of control measures (distancing, masks, vaccination).
- If Rt > 1, each case creates more than one new case and the epidemic grows.
- If Rt = 1, cases stay level (endemic equilibrium).
- If Rt < 1, the epidemic shrinks.
The goal of control measures is to push Rt below 1.
From R0 to growth and doubling time
During early exponential growth, new cases grow like exp(r*t), where r is the growth rate per day. The doubling time is
T_double = ln(2) / r
For example, a growth rate of 0.1 per day (10% per day) gives a doubling time of ln 2 / 0.1 which is about 6.9 days. Growth rate and R0 are linked through the generation time. A simple approximation, correct if the generation interval follows an exponential distribution, is R0 = 1 + r x T_g. With r = 0.1 per day and a mean generation time of 5 days this gives R0 = 1.5. More accurate formulas use the full shape of the generation-time distribution, and getting this shape wrong is a known source of error in real estimates.
The SIR model
Divide a population of size N into three compartments:
- S: susceptible people, not yet infected.
- I: infectious people.
- R: recovered (or removed) people, who are immune and no longer infectious.
People move S to I to R. The equations are:
dS/dt = -beta * S * I / N
dI/dt =  beta * S * I / N - gamma * I
dR/dt =  gamma * I
betais the transmission parameter: effective contacts per person per day. New infections happen at ratebeta * S * I / N, because the chance that a contact of a susceptible person is infectious isI / N.gammais the recovery rate: the mean infectious period is1 / gammadays.
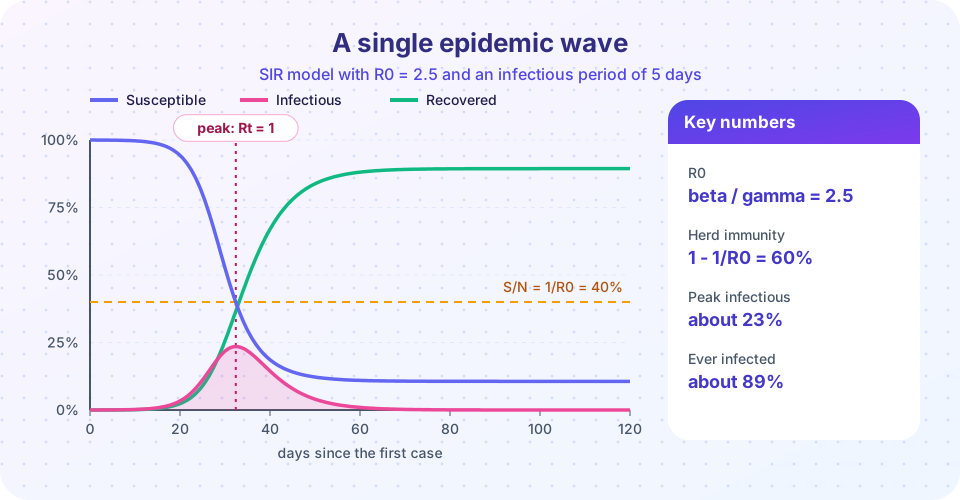
In this model R0 = beta / gamma. The infection grows when the number of new infections beta * S * I / N exceeds the number of recoveries gamma * I, which is exactly when Rt = R0 * S / N > 1. As the epidemic proceeds S falls, so Rt falls, and the peak of the curve occurs when S / N = 1 / R0.
Key results
- Herd immunity threshold: the epidemic starts to decline once
S / N < 1 / R0, so a population is protected when the immune fraction exceeds1 - 1 / R0. For R0 = 2.5 that is 60%; for R0 = 15 it is about 93%. - Peak prevalence (starting nearly fully susceptible):
I_max / N = 1 - (1 + ln R0) / R0. - Final size: the fraction
zof the population ever infected satisfiesz = 1 - exp(-R0 * z). Remarkably, the epidemic always overshoots the herd immunity threshold: even after Rt drops below 1, the infections already in progress keep generating cases.
Because a lower R0 gives a much smaller final size, modest reductions in transmission can cut the total number of infections by a large margin, a nonlinear effect that surprised many policy makers in the early stages of epidemic planning.
Assumptions and limits
The simple SIR model assumes:
- everyone mixes equally (homogeneous mixing);
- immunity is permanent after recovery;
- there are no births, deaths or migration (a "closed" population);
- no delay between infection and becoming infectious.
Real populations violate all of these. Extensions add an E (exposed, latent) compartment to get SEIR, age groups with contact matrices, networks, vaccination, waning immunity and stochasticity (small outbreaks can die out by chance even if R0 > 1). A model is a way to reason about mechanisms and compare scenarios. It is not a crystal ball, and its predictions depend on parameters that are uncertain, especially early in an outbreak.
Common misconceptions
"R0 is a fixed number for each disease." R0 depends on the setting, behavior and how it was estimated. Ranges are more honest than single values.
"An epidemic ends when everyone is infected." It ends when Rt stays below 1. The final size is well below 100% for modest R0.
"If R0 is 3 then every case infects exactly 3 people." It is an average. Often a few people cause many infections (superspreading) and many cause none.
"Reaching the herd immunity threshold means cases stop immediately." Infections in progress continue, so epidemics overshoot.
Try it
Run the SIR model with numerical integration, and compare R0 values. The code also prints the key formulas next to the simulated results as a check.
Press Run (or Ctrl + Enter) to see the result here.
Program input · what you'd type while the program runs
Type the answers before you press Run, one per line. Each time the program reads a line (with input()), it gets the next line from this box.
Now try an interactive version. Drag the R0 slider and watch the curves, or add a "vaccinated at start" fraction to see how immunity before the epidemic flattens it.
Check your understanding
Quick check · 5 questions
of 5 answered You scored / 5 · perfect!
-
1. In the SIR model, which expression gives R0?
R0 is the transmission rate times the mean infectious period, beta x (1 / gamma). -
2. What is the herd immunity threshold if R0 = 4?
Threshold = 1 - 1/R0 = 1 - 0.25 = 0.75. -
3. The epidemic peak in the SIR model occurs when:
At the peak new infections equal recoveries, so Rt = R0 x S/N = 1. -
4. A population has Rt = 0.8. What is expected?
Rt below 1 means each case produces fewer than one new case. -
5. A doubling time of 7 days corresponds to a growth rate of about:
r = ln 2 / 7, about 0.099 per day.
Summary
- R0 is the average number of secondary cases in a fully susceptible population; Rt includes immunity and control measures.
- The SIR model has three compartments and two parameters; R0 = beta / gamma.
- The epidemic peaks when S/N = 1/R0 and the herd immunity threshold is 1 - 1/R0.
- Epidemics overshoot the threshold, and small changes in transmission have large effects on total infections.
- Real epidemics break the model's assumptions (homogeneous mixing, permanent immunity), so models are for scenarios, not exact predictions.
Next: Outbreak investigation
Track your progress
Create a free account to tick off lessons and pick up where you left off on any device.
of Public Health and Epidemiology lessons completed