


















Lesson 7 of 46 · Foundations of Public Health
The determinants of health: why some groups are healthier than others
Understand the layers that shape health, from genes and lifestyle to housing, work and policy, the social gradient, and why upstream causes matter more than downstream fixes.
Two babies are born on the same day in the same country. One arrives in a neighborhood with clean air, safe streets, a well-funded school and a well-paid job waiting for the parents. The other arrives where housing is damp, jobs are insecure and the nearest clinic is two buses away. Decades later, the second child is likely to have a shorter life, more chronic illness and fewer healthy years. Genes cannot explain such a difference by themselves, and neither can individual willpower. Public health calls the broader explanations the determinants of health.
This lesson maps those determinants, introduces the social gradient and the famous Whitehall studies, and shows how epidemiologists quantify inequality. The lesson ends with the idea that guides much of modern public health: when possible, fix the causes upstream instead of rescuing people downstream.
What you will learn
- The layers of the determinants model and an example in each layer.
- What the social gradient is and what the Whitehall studies found.
- How to measure inequality with a rate ratio, a rate difference and excess deaths.
- The difference between upstream and downstream actions, and between equality and equity.
Key terms
- Social determinants of health: the conditions in which people are born, grow, live, work and age, and the wider forces that shape them.
- Social gradient: a stepwise pattern in which health improves with each rise in social position, not only between the poorest and the rest.
- Health inequality: a measurable difference in health between groups.
- Health inequity: an inequality that is avoidable and unfair.
- Upstream intervention: an action on the underlying social or environmental causes, rather than on their downstream effects.
Several models, one message
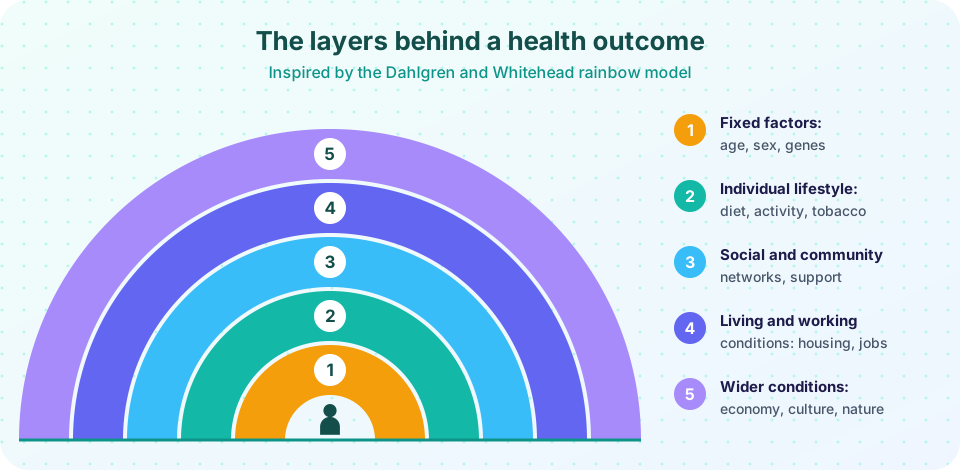
In 1974 the Canadian government published the Lalonde Report, which proposed a "health field concept": health depends on human biology, the environment, lifestyle and health care organization, and yet most spending went to the last of the four. A widely used later model is the rainbow of Göran Dahlgren and Margaret Whitehead (1991), shown in the picture above. At the center is the individual with fixed characteristics: age, sex and inherited factors. Around the person are layers of influence:
- Individual lifestyle factors: diet, physical activity, tobacco and alcohol use, sleep.
- Social and community networks: family, friends, neighbors, and the support or isolation they provide.
- Living and working conditions: housing, education, employment, unemployment, health care services, water and sanitation, agriculture and food.
- General socioeconomic, cultural and environmental conditions: national wealth, income distribution, laws, social norms, climate and pollution.
The layers interact. A tax on tobacco (outer layer) changes behavior (second layer) and, a generation later, the distribution of lung disease. A good school (third layer) improves job prospects, income and health literacy. The World Health Organization's Commission on Social Determinants of Health (2008) summarized the evidence in the slogan "closing the gap in a generation": much of the health inequality between and within countries arises from unequal distribution of power, money and resources, and so is amenable to policy.
Who is affected: the social gradient
Health does not simply divide the poor from the rest. In most countries health improves at every step of the social ladder. The best-known evidence comes from the Whitehall studies of British civil servants, led by Michael Marmot and colleagues. In the first study, which began in 1967, about 18,000 male civil servants in London were examined and followed. Civil servants all had secure jobs and access to health care, yet the mortality rate for men in the lowest employment grades was roughly three times that of men in the highest grade. The difference followed a gradient: each grade had higher mortality than the one above it. Risk factors such as smoking, blood pressure and cholesterol, which also differed by grade, explained only part of the gap.
The later Whitehall II study (from 1985) included women and examined the work environment. It found that employees with little control over their work, despite high demands, had higher rates of heart disease, a result linked to chronic stress and to health-related behaviors. The studies are observational and cannot prove each causal pathway, but they showed that social position matters for health even in a wealthy, insured population, and that the gradient is not just a matter of poverty versus wealth.
Gradients appear along many dimensions: income, education, occupation, neighborhood deprivation. They also appear for conditions as varied as childhood obesity, depression, infant mortality and life expectancy. A related concept is fundamental cause theory (Bruce Link and Jo Phelan, 1995): social resources such as money, knowledge, power and social connections protect health through many routes, so when one disease is controlled by a new technology, those with more resources tend to benefit first, and the gradient reappears for the next disease.
Measuring inequality
Epidemiologists measure inequality with the tools from chapter 3. The most common are:
- Rate ratio (relative inequality): rate in the most deprived group divided by rate in the least deprived. A value of 1.8 means 80 percent higher.
- Rate difference (absolute inequality): the most deprived rate minus the least deprived rate, in the original unit (deaths per 1,000 per year).
- Excess deaths: how many fewer deaths there would be if every group had the rate of the best-off group. This number translates inequality into lives.
Relative and absolute measures can tell different stories, so report both. For example, if the rates for both groups fall by half, the rate ratio stays the same, but the rate difference shrinks. The first demonstration uses invented numbers to compute all three, and shows something important: because the middle groups are large, they contribute most of the excess deaths. Focusing only on the poorest ignores most of the burden. That is why the gradient calls for policies that lift the whole distribution, which echoes the prevention paradox of chapter 1.
Upstream and downstream
A parable, often credited to the sociologist Irving Zola and later used by public health scholars, tells of villagers who keep pulling drowning people out of a river. They become skilled at rescue and build better boats, until someone asks who keeps throwing these people in upstream. Downstream actions treat the consequences of poor health: hospitals, drugs and rehabilitation. Midstream actions change risky behavior of individuals: counseling, advertising campaigns. Upstream actions change the conditions: a tax, a regulation, a minimum wage, an urban plan, school meals. Upstream interventions tend to reach more people and last longer, but their effects arrive later and are harder to evaluate, which is why they are often neglected.
This does not mean that clinical care is unimportant. It means that a complete public health strategy works at all three levels, and that policy makers should ask where the largest preventable burden lies and which layer of the rainbow offers the best opportunity to act.
Equality versus equity
Treating everyone equally does not always produce equal health. Equity means giving people what they need to reach their full potential for health: more resources for those facing more barriers. A mobile vaccination van that visits only villages along the main road is equal in its service but may fail the villages that most need it. Equity-focused public health asks who is being left behind, and why.
A note on causes and fairness
Describing determinants is not blaming individuals, and it is not a claim that individual choices do not matter. They do, but choices are made within a context: it is much easier to eat well when healthy food is affordable and nearby, or to exercise when the streets are safe. Good public health does not lecture people; it tries to make the healthy option the easy option.
Common misconceptions
"The social gradient is just the poor being unhealthy." The Whitehall studies found stepwise differences among people who all had stable jobs. Even people in the second-highest grade did worse than those in the highest.
"Health is mostly down to genes and lifestyle." Both matter, but they are nested within social conditions that shape who can afford a healthy lifestyle in the first place. Different layers explain different parts of the pattern.
"Equal treatment is the same as fair treatment." Equity requires adjusting services to differing needs.
Try it
Press Run (or Ctrl + Enter) to see the result here.
Program input · what you'd type while the program runs
Type the answers before you press Run, one per line. Each time the program reads a line (with input()), it gets the next line from this box.
Check your understanding
Quick check · 5 questions
of 5 answered You scored / 5 · perfect!
-
1. What did the first Whitehall study find about civil servants in the lowest grades compared with the highest?
Health followed a stepwise gradient with employment grade even though all had secure jobs; conventional risk factors explained only part. -
2. Which is an upstream action against obesity?
Upstream actions change the conditions that create the problem for whole populations. -
3. The rate ratio of the most deprived to the least deprived group is 1.5. This means the most deprived group has
A ratio of 1.5 means rates are 1.5 times as high, a 50 percent increase. -
4. Why is it important to report both rate ratio and rate difference?
If both rates halve, the ratio is unchanged but the absolute gap shrinks, so each measure shows something different. -
5. A mobile clinic gives more visits to villages with poorer road access. This is an example of
Equity means distributing resources according to need, not simply the same amount to everyone.
Summary
- Health is shaped by layers: fixed factors, lifestyle, social networks, living and working conditions, and wider socioeconomic and environmental conditions.
- The social gradient means each step up the social ladder tends to bring better health, as the Whitehall studies showed.
- Inequality is measured with rate ratios, rate differences and excess deaths; report both relative and absolute measures.
- Upstream interventions tackle causes and reach more people; equity means distributing resources by need.
Next: Levels of prevention
Track your progress
Create a free account to tick off lessons and pick up where you left off on any device.
of Public Health and Epidemiology lessons completed