


















Lesson 41 of 46 · Projects and Practice
Project: Investigate a Wedding Dinner Outbreak
A guided project: analyze a simulated wedding dinner outbreak with an epi curve, attack rates, relative risks and a stratified check for confounding, then write a short findings report.
In this project you play the role of an epidemiologist at a local health department. A phone call arrives: after a wedding dinner on Saturday evening, many guests have developed vomiting and diarrhea. The caterer wants to know whether the food was to blame, and the bride's family wants to know what to tell the other guests. You will carry out the steps from the outbreak investigation lesson using a dataset that you generate yourself.
The data are simulated. The event, the guests and the numbers are invented for this exercise, and a random seed makes the dataset reproducible. In a real investigation you would build a line list from interviews, but the logic of the analysis is the same.
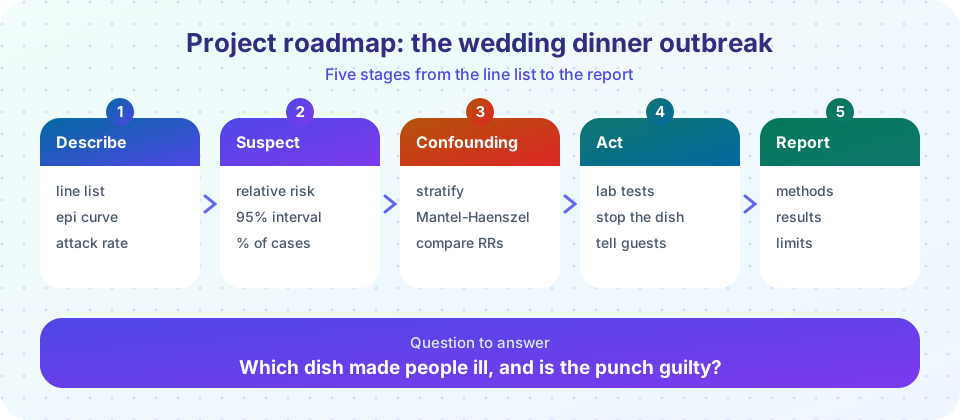
What you will learn
- Build a line list and describe an outbreak by person, place and time.
- Calculate attack rates, relative risks and confidence intervals for several foods.
- Spot and resolve confounding between two foods eaten together.
- Write a brief, honest outbreak report with recommendations.
Key terms
Line list: a table with one row per person, recording exposures, symptoms and onset time.
Attack rate: the proportion of exposed people who become ill.
Confounding between exposures: two foods that are often eaten together, so that a harmless one looks harmful.
Stratified analysis: analyzing the association within groups defined by a third variable.
Incubation period: time from exposure to onset of symptoms.
The scenario
The dinner started at 7 pm on Saturday. There were 150 guests. The menu was a Caesar salad, roast beef, rice, bread, tiramisu for dessert and a sparkling fruit punch. By Monday morning, health officials had heard from guests who developed vomiting, stomach cramps and diarrhea. A case is defined as any guest who attended the dinner and developed vomiting or diarrhea (three or more loose stools in 24 hours) within three days. The clinical picture and the incubation period of about half a day to a day suggest a bacterial food-borne illness such as salmonellosis, but a laboratory test of stool samples would be needed to confirm it.
The simulation makes one dish truly contaminated: the tiramisu, which in this made-up scenario contained undercooked egg. The punch has no effect, but people who ate the tiramisu were also more likely to have the punch, which sets up a confounding trap.
Step 1: build the line list and describe
Run the code below. It creates the line list, prints the first rows and the overall attack rate, and draws an epidemic curve by onset time.
Press Run (or Ctrl + Enter) to see the result here.
Program input · what you'd type while the program runs
Type the answers before you press Run, one per line. Each time the program reads a line (with input()), it gets the next line from this box.
Questions to answer in your notes:
- How many cases are there, and what is the overall attack rate?
- What does the shape of the epidemic curve suggest (point source, continuous or propagated)?
- Is the incubation period consistent with the suspected organism?
Step 2: find the suspect food
For each food item, compute the attack rate among those who ate it and those who did not, the relative risk and its 95% confidence interval, and the share of all cases who ate it. The code below repeats the simulation (the same seed gives the same guests) and prints a table. Look for foods with a high relative risk and a confidence interval that excludes 1.
Press Run (or Ctrl + Enter) to see the result here.
Program input · what you'd type while the program runs
Type the answers before you press Run, one per line. Each time the program reads a line (with input()), it gets the next line from this box.
You should see two items with relative risks above 1 and intervals that exclude 1: the tiramisu, and probably the punch. Which one is the culprit? Both are associated with illness, but the punch might be riding on the tiramisu's coattails.
Step 3: check for confounding
Compare the illness rate for punch drinkers and non-drinkers within each tiramisu group (those who ate tiramisu and those who did not). If the punch is really harmless, the relative risk should be close to 1 in each group. Then compute the Mantel-Haenszel summary.
Press Run (or Ctrl + Enter) to see the result here.
Program input · what you'd type while the program runs
Type the answers before you press Run, one per line. Each time the program reads a line (with input()), it gets the next line from this box.
If the adjusted relative risk is near 1, you can report that the punch association is explained by the tiramisu. Repeat the stratified analysis the other way round (tiramisu within punch strata) and you should find that the tiramisu association survives. That asymmetry is the signature of a confounder.
Step 4: decide what to do
At this stage the evidence points to the tiramisu. In a real investigation you would, in parallel:
- collect leftover food and stool samples for laboratory testing, and identify the organism;
- trace the supplier of the eggs and check how the dessert was prepared and stored;
- advise the caterer to stop serving the dessert and review hygiene practices;
- tell guests who are ill to rest and drink fluids, to seek care if symptoms are severe, and to avoid preparing food for others until symptoms stop (a general public health message, not individual medical advice);
- report confirmed cases of a notifiable disease to the health authority.
Step 5: write a short report
A good outbreak report is short and plain. Use this template:
- Summary: what happened, how many cases, the most likely source, actions taken.
- Methods: case definition, how cases were found, how data were analyzed.
- Results: epidemic curve, attack rates, relative risks, stratified analysis.
- Limitations: possible recall bias in interviews, incomplete guest lists, no laboratory confirmation yet.
- Recommendations: for the caterer, the venue and the health department.
Extension exercises
Once you have finished the five steps, try these variations to deepen your understanding.
- Change the truth. Edit the simulation so that the punch is the contaminated item instead of the tiramisu. Predict, before running it, what the crude and stratified analyses will show. This checks whether you understand why the stratified result points to the real cause.
- Change the sample size. Reduce the number of guests to 40 and rerun the analysis with several seeds. How often does the correct dish stand out? Notice how wide the confidence intervals become, and how often chance produces a misleading association.
- Add recall bias. Let ill guests report that they ate each food with 90% sensitivity, while well guests report with 75% sensitivity. How do the relative risks change? Which foods look worse than they are?
- Make it a case-control study. Pretend you only know 40 cases and 40 randomly chosen non-ill guests. Compute odds ratios for each food and compare them with the relative risks from the full guest list.
- Write the press statement. In three sentences, tell the public what is known, what is not yet known and what they should do. Avoid blame and avoid certainty that the evidence does not support.
Common misconceptions
"The food with the highest relative risk is always the culprit." Foods eaten together can confound each other. Check by stratifying.
"A small outbreak needs no statistics." Even with 150 people, careful comparison prevents blaming the wrong dish.
"We must wait for laboratory results before acting." Control measures should begin when there is a reasonable lead.
Check your understanding
Quick check · 4 questions
of 4 answered You scored / 4 · perfect!
-
1. Why do punch drinkers show a higher illness rate in the crude analysis?
The two foods were eaten together, so the tiramisu confounds the punch association. -
2. What result in the stratified analysis would show that the punch is not a true cause?
If there is no association within strata, the crude association was due to confounding. -
3. A single sharp peak in the epidemic curve suggests:
Everyone was exposed at the same time at the dinner. -
4. Which is a limitation to state in the report?
Recall bias is a standard limitation of interview-based outbreak studies.
Summary
- An outbreak investigation moves from description (person, place, time) to hypothesis, test and action.
- Attack rates and relative risks rank suspect foods, but foods eaten together can confound each other.
- Stratified analysis and the Mantel-Haenszel estimate reveal which association survives.
- A short, honest report states methods, results, limits and recommendations.
Track your progress
Create a free account to tick off lessons and pick up where you left off on any device.
of Public Health and Epidemiology lessons completed