


















Lesson 33 of 46 · Chronic Disease and Prevention
Risk and Burden: RR, Attributable Fractions and DALYs
Compare absolute and relative risk, compute attributable fractions and the population attributable fraction, explain NNT and learn how DALYs combine early death and disability.
Imagine two news headlines. One says "Eating processed meat raises bowel cancer risk by 18%." Another says "Your chance of bowel cancer rises from about 6 in 100 to about 7 in 100 over a lifetime". They can describe exactly the same evidence, yet they sound very different. Epidemiology has several ways of describing risk, and choosing the right one depends on the question: how strong is the link (relative measures), how much extra disease does it cause (absolute measures), and how much disease in a population could be prevented (population measures).
This lesson gives you those measures, with a worked example, and ends with the DALY, the measure global health uses to compare very different diseases on one scale.
What you will learn
- Compute relative risk, risk difference, attributable fraction and population attributable fraction.
- Explain the difference between relative and absolute risk and why headlines mislead.
- Compute number needed to treat (NNT) and number needed to harm.
- Describe how DALYs combine years of life lost and years lived with disability.
Key terms
Relative risk (RR): risk in exposed divided by risk in unexposed.
Risk difference (attributable risk): risk in exposed minus risk in unexposed: the excess risk due to exposure, if the link is causal.
Population attributable fraction (PAF): the share of all cases in a population that would be avoided if the exposure were removed (assuming causation).
NNT: the number of people who must be treated for one to benefit.
DALY: disability-adjusted life year, one lost year of healthy life.
Relative versus absolute
Suppose a cohort study follows smokers and non-smokers for a year and records lung cancer. The (invented) figures are 140 new cases per 100,000 smokers and 10 per 100,000 non-smokers.
| Measure | Formula | Value |
|---|---|---|
| Risk in exposed | 140 per 100,000 | |
| Risk in unexposed | 10 per 100,000 | |
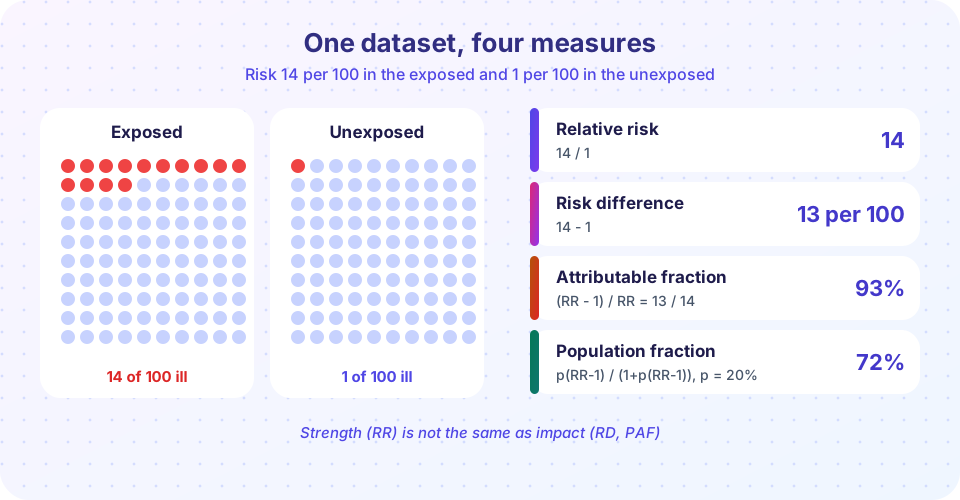
| Relative risk | 140 / 10 | 14 |
| Risk difference | 140 - 10 | 130 per 100,000 per year |
The relative risk (14) says the link is strong; it is the number that Bradford Hill's "strength" viewpoint looks at. The risk difference (130 per 100,000) says how many extra cases occur, and it matters for public health planning. Compare coffee drinkers with a relative risk of 1.1 for some disease that affects 2 in 100,000 people: the extra cases are 0.2 per 100,000, trivial, even though a headline might say "10% higher risk".
Always ask for the baseline risk. A "50% increase" on a risk of 1 in 10,000 is 1.5 in 10,000. A "50% increase" on a risk of 1 in 10 is 1.5 in 10. The first is a footnote, the second is a major public health event. When you are reading research, convert relative changes to absolute ones; when you write for the public, give both.
Odds ratios
Case-control studies cannot compute risks directly, so they report odds ratios (OR). For rare diseases the OR approximates the RR. For common outcomes the OR overstates the RR (it moves farther from 1), which is a common source of misinterpretation when a result is described as "risk".
Attributable measures
If the exposure is a cause, how much of the disease is due to it?
Attributable fraction among the exposed (also called the etiologic fraction):
AFe = (RR - 1) / RR
With RR = 14 the AFe is 13/14 = 93%: among smokers who develop lung cancer, about 93% of those cases are attributable to smoking in the sense of this simple model.
Population attributable fraction adds how common the exposure is. If p is the proportion of the population exposed, Levin's formula gives
PAF = p (RR - 1) / (1 + p (RR - 1))
If 20% of the population smokes and RR = 14: PAF = 0.2 x 13 / (1 + 0.2 x 13) = 2.6 / 3.6 = 0.72. About 72% of lung cancers in this population would be avoided if nobody smoked, if smoking were the only cause and the RR were causal.
Two points require care:
- Prevalence matters as much as strength. A mild risk factor that is very common (physical inactivity) can have a bigger PAF than a strong risk factor that is rare.
- PAFs for several factors do not add up. Many cases have more than one cause, so attributing the same case to each factor can make the sum exceed 100%. Modern analyses use methods that account for overlap.
PAF also assumes that removal of the exposure is possible and that the RR is unconfounded. It is best read as "the share of disease associated with this exposure".
Number needed to treat
For a treatment or preventive intervention, suppose 10% of a control group and 7% of the treated group have a heart attack over five years.
- Absolute risk reduction (ARR) = 10% - 7% = 3 percentage points.
- Relative risk reduction (RRR) = 3 / 10 = 30%.
- NNT = 1 / ARR = 1 / 0.03 = 33.3, usually rounded up to 34.
Thirty-four people must take the treatment for five years to prevent one heart attack. The same 30% RRR in a group at a baseline risk of 1% would give ARR = 0.3 points and an NNT of about 333. NNT shows why treatment decisions depend on a person's baseline risk. The mirror measure is the number needed to harm (NNH): 1 / the absolute increase in a harmful event.
DALYs: comparing burdens
How do you compare a disease that kills young people quickly with one that causes decades of disability? The disability-adjusted life year (DALY), developed in the 1990s for the Global Burden of Disease study, adds two parts:
DALY = YLL + YLD
YLL = number of deaths x standard life expectancy remaining at age of death
YLD = number of cases x disability weight x duration (or prevalent cases x disability weight)
- YLL (years of life lost) measure premature mortality.
- YLD (years lived with disability) measure lost health among survivors. The disability weight ranges from 0 (full health) to 1 (equivalent to death) and reflects the severity of the condition.
A simple example: a disease causes 100 deaths at an average age at which standard remaining life expectancy is 25 years, so YLL = 2,500. It also leaves 1,000 people living with a condition of disability weight 0.2 for one year: YLD = 200. Total burden is 2,700 DALYs. A DALY is "one year of healthy life lost".
DALYs allow comparison between, for instance, road injuries, depression and stroke. Critics note that DALYs rely on value judgments (disability weights, how the life expectancy standard is chosen, whether future years are discounted or weighted by age) and that they may disadvantage older people and people with disabilities. Recent GBD versions use a single standard life expectancy table for all countries and no age weighting, and publish uncertainty intervals.
A related measure is the QALY (quality-adjusted life year), used in cost-effectiveness analysis (chapter 8); it counts years gained rather than years lost.
Common misconceptions
"A 20% increase in risk means a 20% chance of disease." It multiplies the baseline risk. Starting from a small baseline the absolute change may be small.
"The PAFs of all risk factors add up to 100%." They overlap and often add to more than 100% if computed naively.
"A high NNT means a drug does not work." NNT depends on baseline risk and duration. A drug with a large NNT may still be worthwhile for a severe, preventable outcome.
"A DALY is an exact count of health lost." It is a modelled estimate that rests on assumptions.
Try it
First, compute all the measures from a two-by-two table and see how the PAF depends on prevalence of the exposure. The relative risk is held fixed while prevalence changes.
Press Run (or Ctrl + Enter) to see the result here.
Program input · what you'd type while the program runs
Type the answers before you press Run, one per line. Each time the program reads a line (with input()), it gets the next line from this box.
Second, an interactive NNT demonstration with a 100-person icon array. Set the baseline risk and the relative risk reduction, and watch the absolute benefit shrink for lower-risk groups. Numbers are for illustration only.
Check your understanding
Quick check · 5 questions
of 5 answered You scored / 5 · perfect!
-
1. Risk in exposed is 8% and in unexposed 2%. What is the relative risk?
RR = 8% / 2% = 4. The risk difference is 6 percentage points. -
2. What is the attributable fraction among the exposed when RR = 5?
AFe = (RR - 1)/RR = 4/5 = 0.80. -
3. Which factor is most likely to have the greatest PAF?
PAF depends on both strength and prevalence. A very common moderate risk factor can explain many cases. -
4. An intervention reduces risk from 5% to 4%. What is the NNT?
ARR = 1 percentage point = 0.01, so NNT = 1/0.01 = 100. -
5. What two components make up a DALY?
DALY = YLL + YLD.
Summary
- Relative measures show strength of association; absolute measures show how many extra cases occur.
- AFe = (RR - 1)/RR; PAF = p(RR - 1)/(1 + p(RR - 1)) and depends on exposure prevalence.
- NNT = 1 / ARR, and it depends on baseline risk.
- DALYs add years of life lost to years lived with disability, enabling comparison between diseases, with value judgments built into the weights.
Track your progress
Create a free account to tick off lessons and pick up where you left off on any device.
of Public Health and Epidemiology lessons completed