


















Lesson 25 of 46 · Causation and Bias
Selection and Information Bias
How flawed participant selection and flawed measurement distort epidemiology studies: Berkson's bias, healthy worker effect, recall bias and misclassification, with simulations.
Bias is systematic error: a built-in lean in the way a study is designed, carried out or analyzed that pushes results in a particular direction. Unlike random error, it does not average out as you collect more data. A survey of one million people sampled from the wrong population is simply a precise answer to the wrong question.
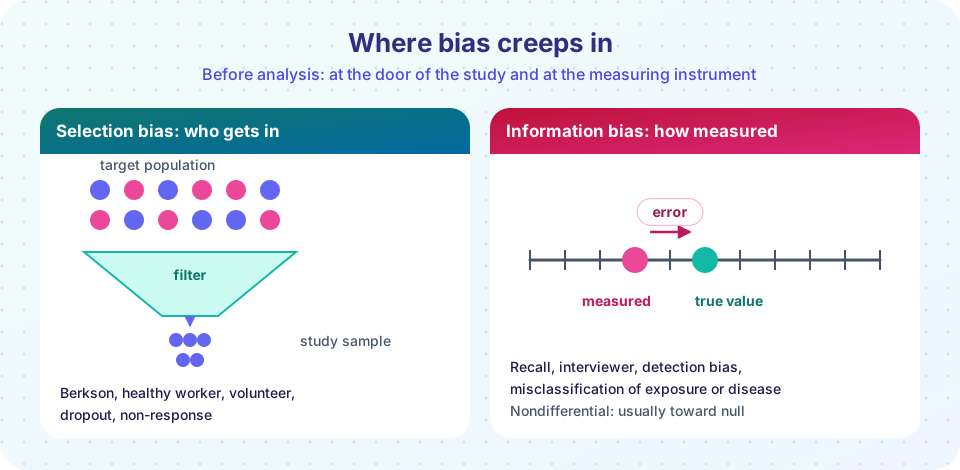
Epidemiologists usually split bias into three families: selection bias (who gets into the analysis), information bias (how exposure and outcome are measured) and confounding (covered in the previous lesson). This lesson covers the first two, with the classic names you will meet in papers, and shows how to reason about the direction of a bias, which is often more useful than a bare list of names.
What you will learn
- Define selection bias and give five named examples.
- Define information bias and distinguish differential from nondifferential misclassification.
- Predict the direction in which a bias pushes a result.
- Describe design choices that prevent each kind of bias.
Key terms
Selection bias: error caused by the way participants are chosen or remain in a study, so that the exposed-outcome relationship differs between those analyzed and the target population.
Information bias: error caused by inaccurate measurement of exposure, outcome or covariates.
Misclassification: putting a person in the wrong exposure or outcome category.
Nondifferential: misclassification that is equally frequent in compared groups.
Differential: misclassification that differs between compared groups.
Selection bias
Selection bias arises when the people who end up in your analysis differ from the target population in a way that is related to both exposure and outcome. The cause may be how you recruit, who agrees to take part, or who drops out.
Named examples
- Berkson's bias (1946). Joseph Berkson, a statistician at the Mayo Clinic, noticed that hospital-based studies can create associations that do not exist in the general population. If each of two unrelated diseases raises the chance of being admitted, then among hospital patients the diseases look negatively related: a patient without disease A is more likely to have disease B, because something had to bring them in.
- Healthy worker effect. Employed people are on average healthier than the general population because seriously ill people leave or never enter work. Comparing a factory's workers with the general population can therefore hide real occupational hazards.
- Volunteer (self-selection) bias. People who volunteer for studies tend to be more health-conscious and better educated. In a screening trial, volunteers may live longer even before screening has any effect.
- Loss to follow-up (attrition). If sicker participants drop out of a cohort, or if people leave for reasons linked to the outcome, the remaining sample no longer represents the starting group.
- Survivor bias. Studying only people who survived long enough to be enrolled, for example recruiting prevalent rather than newly diagnosed cases, excludes those who died quickly. Risk factors for fast death then look protective.
- Non-response. In surveys, those who do not answer may differ systematically, and low response rates (below about 60% in many settings) raise the worry.
A useful example is the control group in a case-control study. Controls must come from the same source population as the cases: they should represent the exposure experience of people who would have been cases had they developed the disease. Hospital controls with a condition related to the exposure, for example choosing patients with chronic bronchitis as controls in a smoking and cancer study, would bias the odds ratio toward the null.
Preventing selection bias
- Define the target population and sample it in a way unrelated to exposure and outcome (random sampling, population-based registers).
- For case-control studies, choose controls from the source population of the cases.
- Keep follow-up high and compare the characteristics of those who drop out with those who stay.
- Use intention-to-treat analysis in trials so that randomization is not broken by post-randomization exclusions.
- Report participation and response rates honestly.
Information bias
Information bias arises when data on exposure or disease status are wrong for some people. Epidemiologists call the resulting errors misclassification. Its direction depends on whether the errors are linked to the other variable.
Nondifferential misclassification
The error rate is the same in cases and controls (or exposed and unexposed). For a simple yes/no variable the usual result is that the true effect is biased toward the null: the odds ratio shrinks toward 1. Imagine a questionnaire that asks about diet 10 years ago; everyone remembers poorly, so real differences blur. Remember the "usual" condition: with more than two exposure categories, or with errors in several variables, or with correlated errors, the direction can change, so do not apply the rule mechanically.
Differential misclassification
The error rate depends on the group, and bias can go either way. The standard example is recall bias: mothers of children with birth defects may search their memory more carefully for possible exposures than mothers of healthy children, and so report exposures more completely. The cases' reporting is more sensitive, which inflates an odds ratio.
Other named examples include:
- Interviewer (observer) bias. An interviewer who knows who is a case probes more for exposures.
- Detection (surveillance) bias. People who are examined more closely are more likely to have a disease detected. If women who use a certain drug see their doctor more often, more of their conditions will be diagnosed.
- Social desirability bias. People underreport alcohol use, drug use and other behaviors that carry stigma.
- Lead-time bias. Screening finds disease earlier, so survival measured from diagnosis looks longer even if death occurs at the same age (chapter 7).
Preventing information bias
- Use objective measurement (laboratory tests, records made before the disease occurred, biomarkers) instead of memory when possible.
- Blind interviewers and outcome assessors to case or exposure status; in trials use placebos and double blinding.
- Use standardized instruments and train staff.
- Collect exposure data before the outcome is known (prospective cohort designs).
- Validate a sample against a gold standard so you can estimate the size of the misclassification.
Thinking about direction
When you read a study, ask: which way would this bias push the estimate, and is it large enough to change the conclusion? A cohort result that shows a protective effect of exercise on heart disease might be inflated by the healthy-volunteer effect. If the claim is a harmful effect that survives a bias that would hide harm, the finding becomes more convincing. Quantitative bias analysis formalizes this by feeding plausible misclassification rates into corrections like the ones in the simulation below.
Common misconceptions
"Nondifferential misclassification always biases toward the null." True for a simple binary exposure when errors are independent of other errors. It can fail with several categories or correlated errors.
"Bias means the researchers did something wrong." Many biases are built into the available data, such as hospital records. Good researchers anticipate and measure them.
"A big sample reduces selection bias." A bigger sample from the same flawed source has the same flaw.
Try it
The first simulation applies misclassification to a case-control study. The true odds ratio is about 2.3. See what happens when exposure is measured with a questionnaire that has some error, and when cases remember better than controls.
Press Run (or Ctrl + Enter) to see the result here.
Program input · what you'd type while the program runs
Type the answers before you press Run, one per line. Each time the program reads a line (with input()), it gets the next line from this box.
The second simulation reproduces Berkson's bias. Two diseases are generated independently, so any link between them inside the hospital is created entirely by who gets admitted.
Press Run (or Ctrl + Enter) to see the result here.
Program input · what you'd type while the program runs
Type the answers before you press Run, one per line. Each time the program reads a line (with input()), it gets the next line from this box.
Check your understanding
Quick check · 5 questions
of 5 answered You scored / 5 · perfect!
-
1. Two unrelated diseases both increase the chance of hospital admission. What happens to their association among hospital patients?
Among admitted patients, lacking one disease makes it more likely that the other explains the admission. -
2. Mothers of babies with birth defects remember past exposures more thoroughly than other mothers. This is an example of:
Reporting accuracy differs between cases and controls, so the error is differential. -
3. For a binary exposure measured with the same error in everyone, what is the usual direction of the bias?
Nondifferential misclassification of a binary exposure typically dilutes the association toward OR or RR = 1. -
4. Which step best reduces interviewer bias?
Blinding stops knowledge of status from changing how questions are asked. -
5. A cohort loses most of its sickest participants before the end. Which bias is this?
Dropout related to the outcome means the analyzed group no longer represents the starting cohort.
Summary
- Selection bias depends on who is analyzed; information bias depends on how things are measured.
- Named selection biases include Berkson's bias, healthy worker effect, volunteer bias, loss to follow-up, survivor bias and non-response.
- Nondifferential misclassification of a binary exposure usually biases toward the null; differential misclassification can bias in either direction.
- Prevent bias by design (sampling, blinding, objective measures) because analysis alone cannot repair it.
- Always ask which direction a bias pushes and whether it could explain the result.
Track your progress
Create a free account to tick off lessons and pick up where you left off on any device.
of Public Health and Epidemiology lessons completed