


















Lesson 12 of 46 · Measuring Disease
Incidence and prevalence: new cases, existing cases and the bathtub
Understand cumulative incidence, incidence rate, point and period prevalence, and the relationship prevalence is roughly incidence times duration, with a bathtub model and simulation.
When a journalist says "diabetes affects 10 percent of adults" and a researcher says "the incidence of diabetes rose by 5 percent last year", they are talking about different things. The first number counts everyone who has the disease now, the second counts how many people got it recently. These two measures, prevalence and incidence, are the most basic ways of describing how common a disease is. Mixing them up leads to wrong conclusions, such as thinking a disease is becoming more common when it is simply that patients now live longer.
This lesson defines both measures, shows how they relate through the "bathtub" model, and explains when to use each. You will see why the formula prevalence ≈ incidence × duration is one of the most useful ideas in descriptive epidemiology.
What you will learn
- The definitions of cumulative incidence, incidence rate, point prevalence and period prevalence.
- How incidence, prevalence and duration are connected (P ≈ I × D).
- Why prevalence can rise even when incidence falls.
- Which measure to use for causes, for burden and for planning services.
Key terms
- Incidence: the occurrence of new cases in a population at risk over a period.
- Cumulative incidence (risk): the proportion of a disease-free group that develops disease during a period.
- Incidence rate: new cases per unit of person-time at risk.
- Prevalence: the proportion of a population that has the condition at a given time (point prevalence) or during a period (period prevalence).
- Duration: how long a case stays a case, until recovery or death.
Incidence: the arrival of new cases
Incidence looks at new cases only. Two versions are common.
Cumulative incidence (also called incidence proportion or risk) is the number of new cases divided by the number of people at risk at the start of the period:
cumulative incidence = new cases during period / people at risk at start
If 200 disease-free adults are followed for a year and 8 develop influenza, the one-year cumulative incidence is 8/200 = 0.04, or 4 percent. It requires a closed group followed for the whole period, and a stated time. The number of people "at risk" excludes those who already have the disease and, often, those who are immune.
Incidence rate (incidence density) divides new cases by person-time at risk, which handles uneven follow-up and open populations, as you saw in the previous lesson. For example, 8 new cases in 190 person-years gives a rate of about 0.042 per person-year, or 42 per 1,000 person-years.
Incidence is the measure of choice for studying causes and risk, because it counts the moment disease begins, and for monitoring outbreaks. In an infectious outbreak, you will hear the attack rate (the proportion of those exposed who fall ill) and the secondary attack rate (the proportion of contacts of a case who fall ill), both of which are incidence proportions.
Prevalence: the stock of existing cases
Prevalence counts all cases, new and old, in a population at a time:
prevalence = number of existing cases / total population
Point prevalence is measured at one moment: "On 1 January, 80 of 1,000 residents had asthma" gives 8 percent. Period prevalence counts anyone who had the disease at any time during a period, such as a year. Lifetime prevalence counts people who have ever had the condition. Because prevalence includes both newly occurring cases and cases that began long ago, it reflects both how often the disease starts and how long it lasts.
Prevalence is a proportion with no follow-up needed: a cross-sectional survey, taken on one occasion, can estimate it. This makes it cheap, which is why many national health surveys report prevalence (of obesity, hypertension, depression). It is the measure of choice for describing the burden of a condition and for planning services: a hospital needs to know how many people with diabetes need care now.
The bathtub model
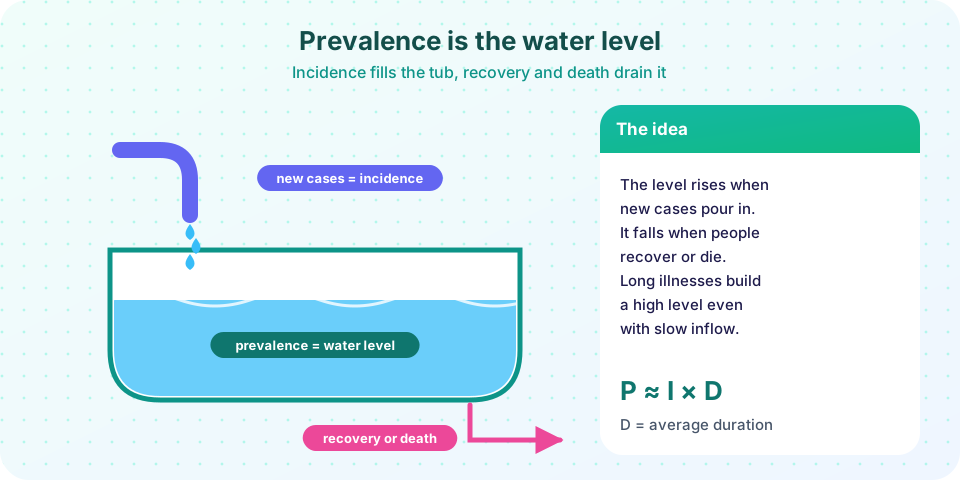
Think of the cases in a population as water in a bathtub. The tap is incidence: new cases pour in. The drain is recovery or death: people leave the pool of cases. The water level is prevalence. If the tap flows faster than the drain, the level rises. If the drain is faster, it falls. When both are balanced, the level stays steady.
A longer disease means a slower drain. Imagine two diseases with the same incidence, one that lasts a week and one that lasts ten years. Over time, the long disease accumulates in the population, and its prevalence becomes much larger than the short disease's, even though they strike equally often.
Under steady conditions (stable incidence and duration, a stable population), this gives the central relationship:
prevalence odds = incidence rate × mean duration
and, when the disease is rare (prevalence below about 10 percent), P ≈ I × D. For example, if 5 new cases occur per day, and each lasts on average 20 days, the number of cases present at any time is about 5 × 20 = 100. If the duration triples to 60 days, the number present rises to about 300. The second demonstration below simulates exactly this, with random arrivals and random durations, and the simulated numbers come out close to the formula.
A numerical example
Suppose the incidence of a disease is 500 per 100,000 per year, and cases last on average 4 years. Then P ≈ 500 × 4 = 2,000 per 100,000, or 2 percent. If a new treatment does not cure it but doubles survival to 8 years, the incidence is unchanged but the prevalence doubles to about 4 percent. The disease did not become more common in the sense of risk; the tub just drains more slowly. This is exactly what happened with several conditions for which treatment has improved, such as HIV infection with modern therapy and many cancers: more people live with the disease, so prevalence rises, which is good news for the patients but increases the need for services.
Why prevalence can mislead about causes
Because prevalence blends incidence and duration, a factor that makes a disease last longer will make prevalence higher, even if it does not cause the disease. Suppose people with a severe form of an illness die quickly, so they rarely appear in a prevalence survey. Then the survey will see mostly milder, longer-lasting cases, and an exposure that increases mortality might appear protective. This is called prevalence-incidence bias (or survivor bias). For questions about cause, incidence is usually the right measure.
Prevalence can also change because of migration, because the diagnostic criteria changed, or because screening finds more people with the disease. Screening increases prevalence of diagnosed disease without any change in actual risk, which is why diagnostic changes must be accounted for when interpreting trends.
Which measure to use?
| Question | Better measure |
|---|---|
| What is the chance that a healthy person will get this disease? | Incidence (risk or rate) |
| Does an exposure raise the risk of disease? | Incidence |
| How many people need care for this condition right now? | Prevalence |
| How big is the burden on the health system? | Prevalence (and duration) |
| How fast is an outbreak spreading? | Incidence |
| What share of adults have high blood pressure? | Prevalence |
In practice, both are reported side by side.
Common misconceptions
"Higher prevalence means the disease is spreading faster." Not necessarily. Prevalence rises when incidence rises or when duration lengthens. A fall in the death rate among patients can increase prevalence.
"Incidence and prevalence are interchangeable." Incidence counts new cases; prevalence counts all existing cases. They are connected by duration but they are different.
"P = I × D is exact." It is an approximation for a stable situation and rare disease. For common conditions, the exact formula uses odds.
Try it
Press Run (or Ctrl + Enter) to see the result here.
Program input · what you'd type while the program runs
Type the answers before you press Run, one per line. Each time the program reads a line (with input()), it gets the next line from this box.
Check your understanding
Quick check · 5 questions
of 5 answered You scored / 5 · perfect!
-
1. Which statement describes prevalence?
Prevalence counts existing cases, old and new, as a proportion of the population. -
2. A disease has an incidence of 200 per 100,000 per year and an average duration of 3 years. The prevalence is approximately
P is approximately I x D = 200 x 3 = 600 per 100,000. -
3. A new treatment keeps patients alive longer without curing a disease. What happens to incidence and prevalence?
Longer duration slows the drain of the bathtub, so prevalence increases while incidence is unchanged. -
4. Which measure is most appropriate for studying whether an exposure causes a disease?
Incidence captures the onset of disease, so it is less affected by factors that only change duration. -
5. In 150 disease-free people followed for one year, 6 develop the disease. The one-year cumulative incidence is
6 / 150 = 0.04, which is 4 percent.
Summary
- Incidence counts new cases (as risk or as a rate); prevalence counts existing cases at a point or during a period.
- Prevalence depends on incidence and duration: P ≈ I × D when a disease is rare and conditions are stable.
- Better treatment that prolongs life without curing raises prevalence.
- Use incidence for causes and risk, prevalence for burden and service planning.
Track your progress
Create a free account to tick off lessons and pick up where you left off on any device.
of Public Health and Epidemiology lessons completed