


















Lesson 22 of 46 · Causation and Bias
Causation and Bias: Chapter Overview
A map of chapter 5: why an association is not yet a cause, and how chance, bias and confounding are tested before epidemiologists claim that something causes disease.
Chapters 3 and 4 gave you tools to count disease and to design studies. This chapter asks the harder question: when you find that people with a certain exposure get more disease, does the exposure cause it? Public health actions are expensive and sometimes unpopular. We ban products, change water supplies and vaccinate millions. That is only justified when the link is causal, so epidemiologists have developed careful habits for deciding when an association can be trusted.
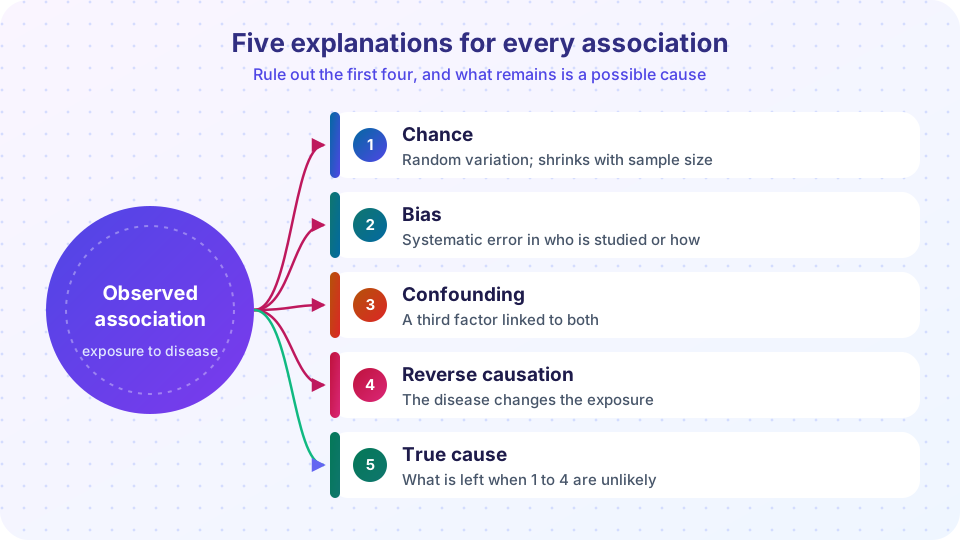
The central lesson is simple to say and hard to practice. Every observed association has four possible explanations besides a true cause: chance, bias, confounding and reverse causation. A good epidemiologist treats each one as a suspect and tries to eliminate it before announcing a cause.
The big picture
Imagine a study finds that people who drink more coffee have more heart disease. Before you cancel your breakfast, work through the suspects:
- Chance. The sample was small, and the difference could be a fluke. Confidence intervals and p-values address this (see your statistics lessons, or the track at /statistics-probability).
- Bias. The way people were selected, or the way exposure and outcome were measured, pushed the result in a particular direction. Bias is a systematic error: collecting more data of the same kind does not fix it.
- Confounding. A third factor, for example smoking, is linked to both coffee and heart disease. Coffee looks guilty only because it keeps bad company.
- Reverse causation. The disease (or its early signs) changed the exposure. People told to cut down on salt because of early heart trouble make salt look protective.
- A true causal effect. Only after the other four are made unlikely do we say the exposure probably causes the outcome.
Notice the order of ideas. Chance is the one students learn first, but in observational research bias and confounding are usually the bigger threats. A huge study can give a very narrow confidence interval around a wrong answer.
What each lesson covers
| Lesson | Question it answers |
|---|---|
| Confounding and association | How can a third factor create or hide an association, and how do we control for it? |
| The Bradford Hill viewpoints | What kinds of evidence move us from association toward cause? |
| Selection and information bias | How do flawed sampling and flawed measurement distort results? |
| Chapter review | A one-page picture, a recap table and ten questions. |
Association is not cause
Chance
Bias
Confounding
Judging cause
A short history of why this matters
In the 1950s many doctors smoked, and tobacco companies argued that the link between cigarettes and lung cancer was "merely statistical". Richard Doll and Austin Bradford Hill answered with careful studies (a case-control study in 1950 and a cohort study of British doctors from 1951) and systematically tried to knock down every alternative explanation. Their work is the best-known example of causal reasoning in epidemiology, and you will meet it again in the Bradford Hill lesson.
The opposite mistake has also happened. Observational studies in the 1980s and 1990s suggested that hormone replacement therapy protected women against heart disease. Large randomized trials later, notably the Women's Health Initiative, did not confirm the benefit and found some harms. A likely explanation is that women who chose hormone therapy were healthier and wealthier to begin with, a classic confounding problem. The lesson is not that observational research is useless. It is that the stakes of causal claims are high enough to deserve this chapter.
Three kinds of causal question
Not every question in epidemiology asks the same thing. It helps to separate three types:
- Etiologic questions ask what causes a disease: does a chemical cause cancer, does a virus cause a particular syndrome?
- Intervention questions ask what would happen if we changed something: if a city introduced a smoke-free law, would heart attacks fall?
- Prognostic questions ask who will do well or badly, regardless of cause: which patients are likely to develop complications? A prognostic factor need not be a cause.
Most of this chapter concerns the first two. The logic of the second is counterfactual: we want to know what would have happened to the same people if they had been exposed differently. We can never observe both outcomes for the same person, so we use groups. A comparison group stands in for the counterfactual, and confounding or bias means that the stand-in is poor. Seen this way, randomization is attractive because it creates groups that are comparable in expectation, and observational methods are attempts to approximate that comparability by design or analysis.
Causes come in sets
A second idea that will help throughout is that diseases rarely have a single cause that is by itself enough. Kenneth Rothman's sufficient-component cause model pictures each sufficient cause as a pie whose slices are component causes. A disease occurs when one complete pie is filled. Smoking may be a slice in many pies for lung cancer, but other slices (genetic susceptibility, radon, asbestos) complete the pie in different people. Two consequences follow. First, the same exposure can be a cause of disease for some people and irrelevant for others. Second, the "proportion of disease caused by" each factor can exceed 100% in total, since one case can involve several component causes that were each necessary for that pie. This is a conceptual reason why attributable fractions for different risk factors do not add up neatly.
How to read this chapter
Read the lessons in order. For every example, practice the habit of naming the explanation you suspect first, and say in which direction it would push the result. When you meet a numerical example, try to compute the result by hand before running the code; the simulations are there to check your reasoning and to let you change the assumptions and see what happens. The review lesson will ask you to put all the pieces together.
Key vocabulary for the chapter
Association: a statistical link between an exposure and an outcome.
Causation: a relationship where changing the exposure would change the risk of the outcome.
Bias: systematic error in the design, conduct or analysis of a study.
Confounding: mixing of the exposure's effect with the effect of another factor.
Counterfactual: what would have happened to the same people if the exposure had been different.
Try it
The first demonstration is a toy world in which coffee does nothing to the heart, yet a naive comparison makes it look harmful. All numbers are invented for illustration.
Press Run (or Ctrl + Enter) to see the result here.
Program input · what you'd type while the program runs
Type the answers before you press Run, one per line. Each time the program reads a line (with input()), it gets the next line from this box.
The second demonstration lets you feel how chance alone can create "associations". Each click runs a fake study with no real effect.
Check your understanding
Quick check · 4 questions
of 4 answered You scored / 4 · perfect!
-
1. Which of these is a systematic error that does not shrink when the sample gets larger?
Bias pushes results in one direction. Larger samples reduce random error but repeat the same bias. -
2. Early signs of a disease make people give up alcohol, so non-drinkers look sicker. What is this called?
The outcome (or its early stage) influenced the exposure, not the other way round. -
3. Why do large observational studies not automatically prove causation?
Size reduces chance variation only. Systematic problems stay. -
4. Which explanation is considered LAST in the chapter's checklist?
A causal interpretation is reached only after chance, bias, confounding and reverse causation have been made unlikely.
Summary
- An association has five possible explanations: chance, bias, confounding, reverse causation, or a true cause.
- Bias and confounding are systematic errors; more data does not remove them.
- Famous examples (smoking and lung cancer; hormone therapy and heart disease) show both the power and the risks of causal reasoning.
- The next lessons give you tools for confounding, for judging causation and for spotting bias.
Track your progress
Create a free account to tick off lessons and pick up where you left off on any device.
of Public Health and Epidemiology lessons completed